
Is the bay filling in at an unnatural rate?
Morro Bay is an estuary, an area where freshwater from land mixes with the saltwater of the ocean. Estuaries are destined to fill in over time, converting eventually to mudflats and then marshes. Under natural conditions, this process would take thousands of years. Human activities can accelerate the sedimentation process, reducing the timescale of the process to hundreds of years.
This accelerated sedimentation has both human and ecological impacts. The bay mouth fills in and becomes dangerous for boats to navigate, necessitating annual dredging. The back bay becomes shallow and silty with reduced water circulation, leading to low oxygen conditions that impact aquatic life. These changes in the bay mean loss of habitat for birds, excess algae growth, and impacts to industries like tourism and shellfish farming.
Natural phenomena like winds and ocean currents can also affect sediment transport to the bay.
Understanding a Changing Bay: Sediment Sampling
The Estuary Program has partnered with California Polytechnic State University (Cal Poly) to study this issue. A portion of the project focused on sampling the sediment on the bottom of the bay to determine differences between different regions of the bay. At the mouth, there is more sand and gravel due to the stronger currents, tidal flushing, and wave action that sweep away the finer silts and clays. In the back bay, the currents are much weaker, and because of the poor circulation, the water remains there for longer periods of time. Two creeks, Chorro and Los Osos, empty into the bay, bringing with them fine silts and clays. These sediments eventually settle out in areas with weaker currents, causing the back bay to become shallower and siltier over time.
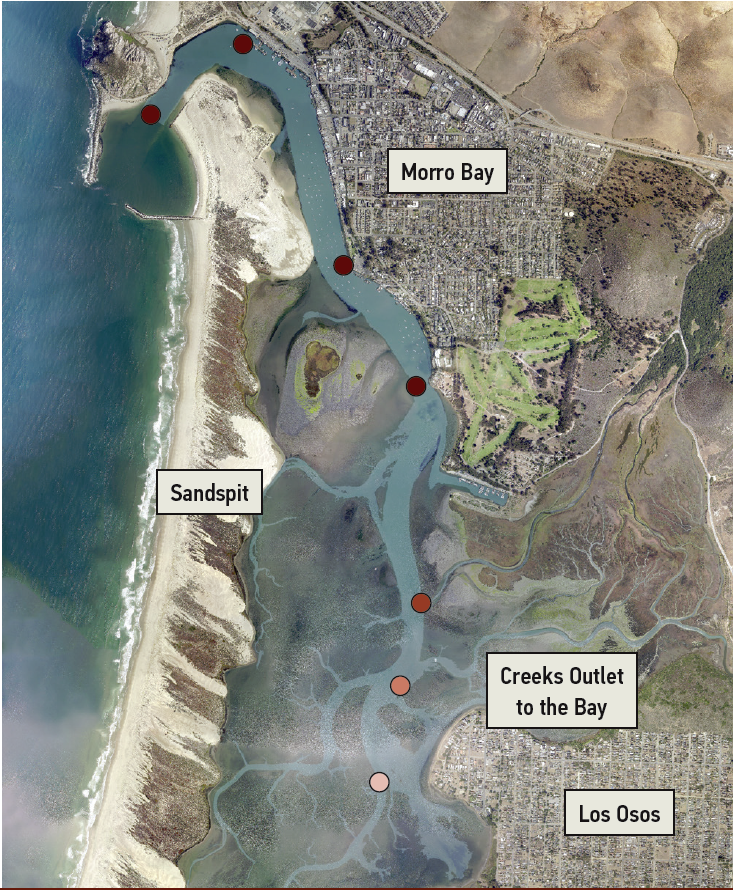
The map shows the results of sediment sampling from subtidal locations during the winter of 2019. The percent of sand and gravel is nearly 100% near the bay mouth (i.e., sediment is composed of all sand and gravel). In the mid to back bay, the bottom sediment is made up of only 30–60% sand and gravel, with the remaining sediment made up of finer silts and clays. These changes in the composition of the bay bottom can have impacts for aquatic life. The fine silty material is more easily stirred up and takes longer to settle back to the bottom. This can lead to cloudy (turbid) waters that block the sunlight from reaching eelgrass, a photosynthesizing plant.
Mapping the Bay Floor
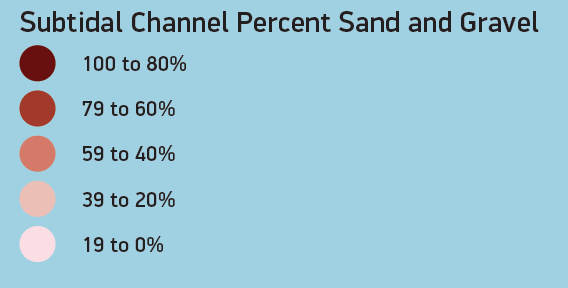
One way to study the changing bay is to conduct a topobathy lidar survey, which is an underwater map of the bay floor. The bathymetry data is collected using sonar from a boat in the deeper channels, and data from topographic lidar (laser pulses used to measure the distance to the earth) is captured from a plane to map the shallower areas. The data sets are seamed together to create a comprehensive map of bay floor elevation. The Estuary Program conducted a topobathy lidar survey of the bay in spring 2019. By comparing this 2019 data set to historic bathymetry maps, we can track changes in the bay over time.
The numbers in the legend for the topobathy lidar map refer to the elevation of the bay bottom relative to the average height of the lowest tide of the day (referred to, here, as MLLW). The map shows approximate differences in bay depths between a 2009–2010 survey and the 2019 survey, in feet. The white areas are those with very little change (between – 0.25 feet to + 0.25 feet in elevation change). Areas that are green represent locations that have a higher elevation in 2019 than in 2009–2010, which means sediment was deposited in those areas. Areas on the map in shades of blue are locations with lower elevations in 2019 than in 2009–2010.

What is tidal prism?
Tidal prism is the difference between the volumes of water occupying the location at high and low tide. In estuaries like Morro Bay, it is a mixture of freshwater from creeks and more saline water coming in from the ocean on the flood tide. It can also be described as the volume of water exchanged between mean high tide and mean low tide or the volume of water leaving an estuary at ebb tide. The volume of the tidal prism relative to the total bay volume influences how well the bay is flushed out, sediment transport, and other factors. Between 1881 and 1998, Morro Bay’s tidal prism decreased by approximately 20 to 30%, and the volume of water in Morro Bay at mean high water decreased by approximately 20 to 25%.
To help determine the status of Morro Bay in terms of sedimentation, the tidal prism must be measured periodically. In addition to a topobathy lidar survey, the Estuary Program conducted a tidal height study in 2019.

The Estuary Program plans to use this data to calculate the current tidal prism for comparison to historic data.
Salt Marsh Impacts
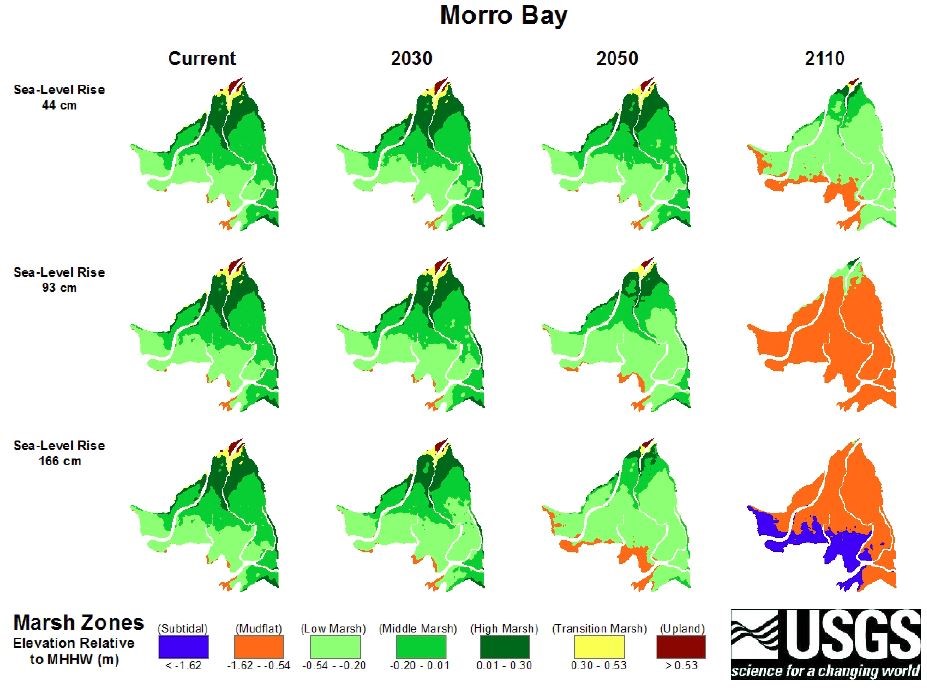
As sediment is transported from the watershed by Chorro and Los Osos Creeks, it is deposited into the salt marsh area of the bay. Our efforts to map salt marsh change over time shows the expansion of marsh areas and the resulting shifts in habitat. More recently this analysis has shifted to include potential sea level rise impacts. A multi-year USGS research project studied seven west coast estuaries, including Morro Bay. Their modeling showed the potential shifts in habitat type of the salt marsh, depending on how much seas rise with climate change.
How to Measure Elevation Changes in a Tidal Marsh
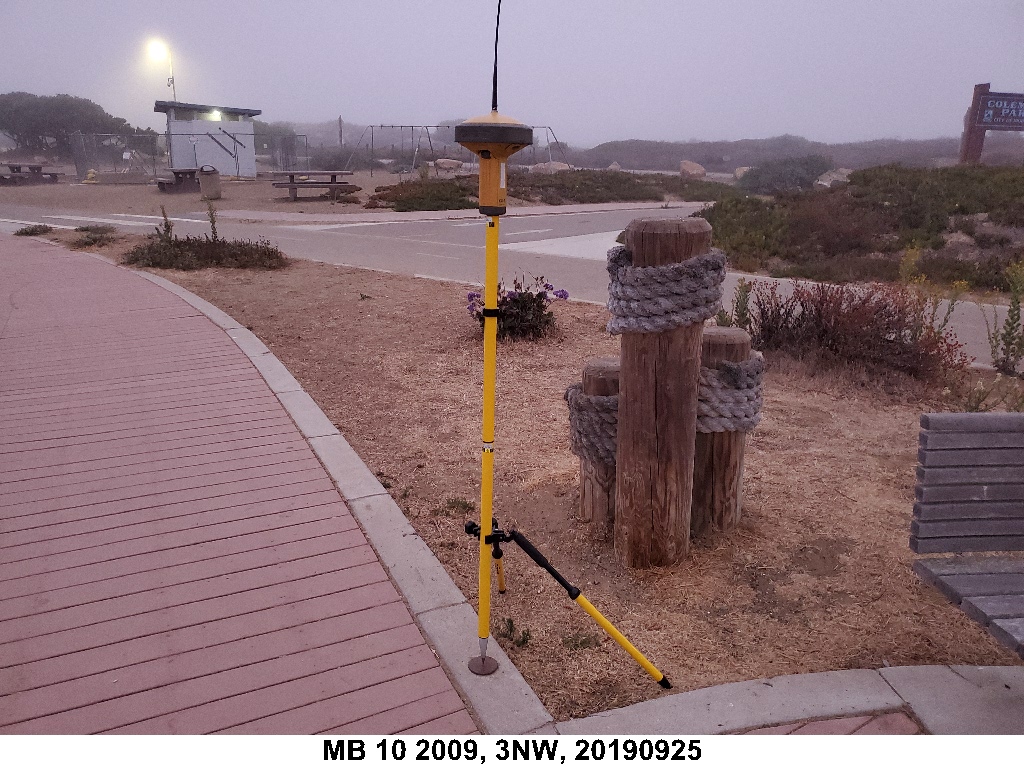
As part of their west coast project, the USGS team measured changes in elevation in Morro Bay’s salt marsh using sediment elevation tables (SETs). At each marsh site, a benchmark post was fixed in place. This identifies the monitoring location and sets the reference elevation for future measurements. Scientists returned to each site and fixed a high precision arm to the benchmark to measure the changes in elevation.
As part of their study, in 2013 two high marsh SETs and two low marsh SETs were installed in the Morro Bay salt marsh. They were read seven times between April 17th, 2013 and February 4th, 2019. The cumulative elevation change for all four SETs was 5.39 mm, which means that the elevation increased. The high marsh SET cumulative elevation change was 2.66 mm, while the low marsh SET had an elevation change of 8.11 mm. The rate of elevation change was 0.50 mm/yr in the high marsh and 1.15 mm/yr in the low marsh.
While marsh elevation change is roughly the same as sea level rise, projected increases in the rate of rising oceans will quickly outpace the marsh elevation change, as depicted in the model results above.

Thank You To Research Partners
The Estuary Program has partnered with Cal Poly physics professor Ryan Walter, United States Geological Survey scientist Sean Vitousek, and former Cal Poly faculty Jennifer O’Leary to study circulation and sedimentation in the Morro Bay estuary. This research will help us better understand changes in the bay, as well as what might happen in the future with climate change and the resultant sea level rise.
We feel fortunate that Morro Bay was included in Dr. Thorne’s west coast tidal marsh study, and we appreciate the generosity of Dr. Thorne and her team in sharing results.
Video Presentation: How Fast is the Morro Bay Estuary Filling In?
How fast is the Morro Bay Estuary filling in? How does this process, called sedimentation, affect people and wildlife? Find the answers to these questions in this video presentation by Estuary Program Assistant Director Ann Kitajima.
Data Notes
For general sedimentation information:
https://link.springer.com/referenceworkentry/10.1007/0-387-30843-1_463
Notes on the Morro Bay topobathy lidar map:
When utilizing mapping data, it is important to understand the error associated with the collection of the data. The historic data was from NOAA, and the following information was provided for the data set:
- Note: This data set was created by merging topographic LIDAR from the 2009-2011 CA Coastal Conservancy Lidar: Coastal California data set, 2009-2010 USACE JALBTCX topobathy LIDAR, and multibeam data provided by the California Seafloor Mapping Program (CSMP) Ocean Protection Council and NOAA NCEI. The vertical accuracy is dependent upon the specific data set and the value listed here may not be representative of all areas. There are two versions of this data set, one with voids and one where voids have been interpolated. This is the interpolated data.
- Vertical Accuracy (cm): 15 – Not tested
- Horizontal Accuracy (cm): 300 – Not tested
- Data classes available:
- Tide controlled: Yes
- https://coast.noaa.gov/dataviewer/#/lidar/search//details/8684
For the 2019 survey, the accuracy information is as follows:
- LiDAR Non-Vegetated Vertical Accuracy: 0.035 meters
- Bathymetric Vertical Accuracy for Submerged Points: 0.101 m
- Bathymetric Vertical Accuracy for Wetted Edge Points: 0.058 m
- LiDAR Relative Vertical Accuracy: 0.025 m
- The survey data meets the National Standard for Spatial Data Accuracy.
The 2019 survey has substantially better accuracy than the historic information collected in 2009 to 2011.
Morro Bay Sediment Total Maximum Daily Load: https://www.waterboards.ca.gov/centralcoast/water_issues/programs/tmdl/docs/morro/sediment/
Karen Thorne publication on sea level rise impacts on tidal marshes: https://pubs.er.usgs.gov/publication/ofr20161125
The SLR impacts on Morro Bay’s tidal marsh were analyzed with the WARMER model and three NRC sea level rise scenarios.
How to Read Estuary Health Symbols
The Estuary Health Symbols represent how the status of each question is changing over time. A round symbol indicates that the trend is stable. An arrow indicates an improving trend (up arrow) or a worsening trend (down arrow). The color of the base of the arrow indicates the status of historical data and the color of the triangular part of the arrow indicates the status of the newer data. The color of the symbol indicates the status as follows: Good/Very Good (green), Fair (yellow), Poor (orange), Very Poor (red), and Unknown (grey).
-

This symbol indicates that the water quality was Very Poor and has improved to Poor.
-

This symbol indicates that the trend is stable but we lack adequate data to assign a status.
-

Very Good/Good
-

Fair
-

Poor
-

Very Poor
-
Unknown