Estuary Program staff and volunteers conduct monitoring throughout the bay and creeks to assess conditions and how they may be changing over time. One of these efforts is bioassessment monitoring, an intensive survey effort requiring hundreds of field hours by our staff and volunteers. This long-running dataset spans nearly 30 years and helps us understand the changing conditions of our watershed. The field effort is typically completed by June, and the results are available in the fall. After some number crunching and data analysis, we are very excited to share our results!
What is Bioassessment?
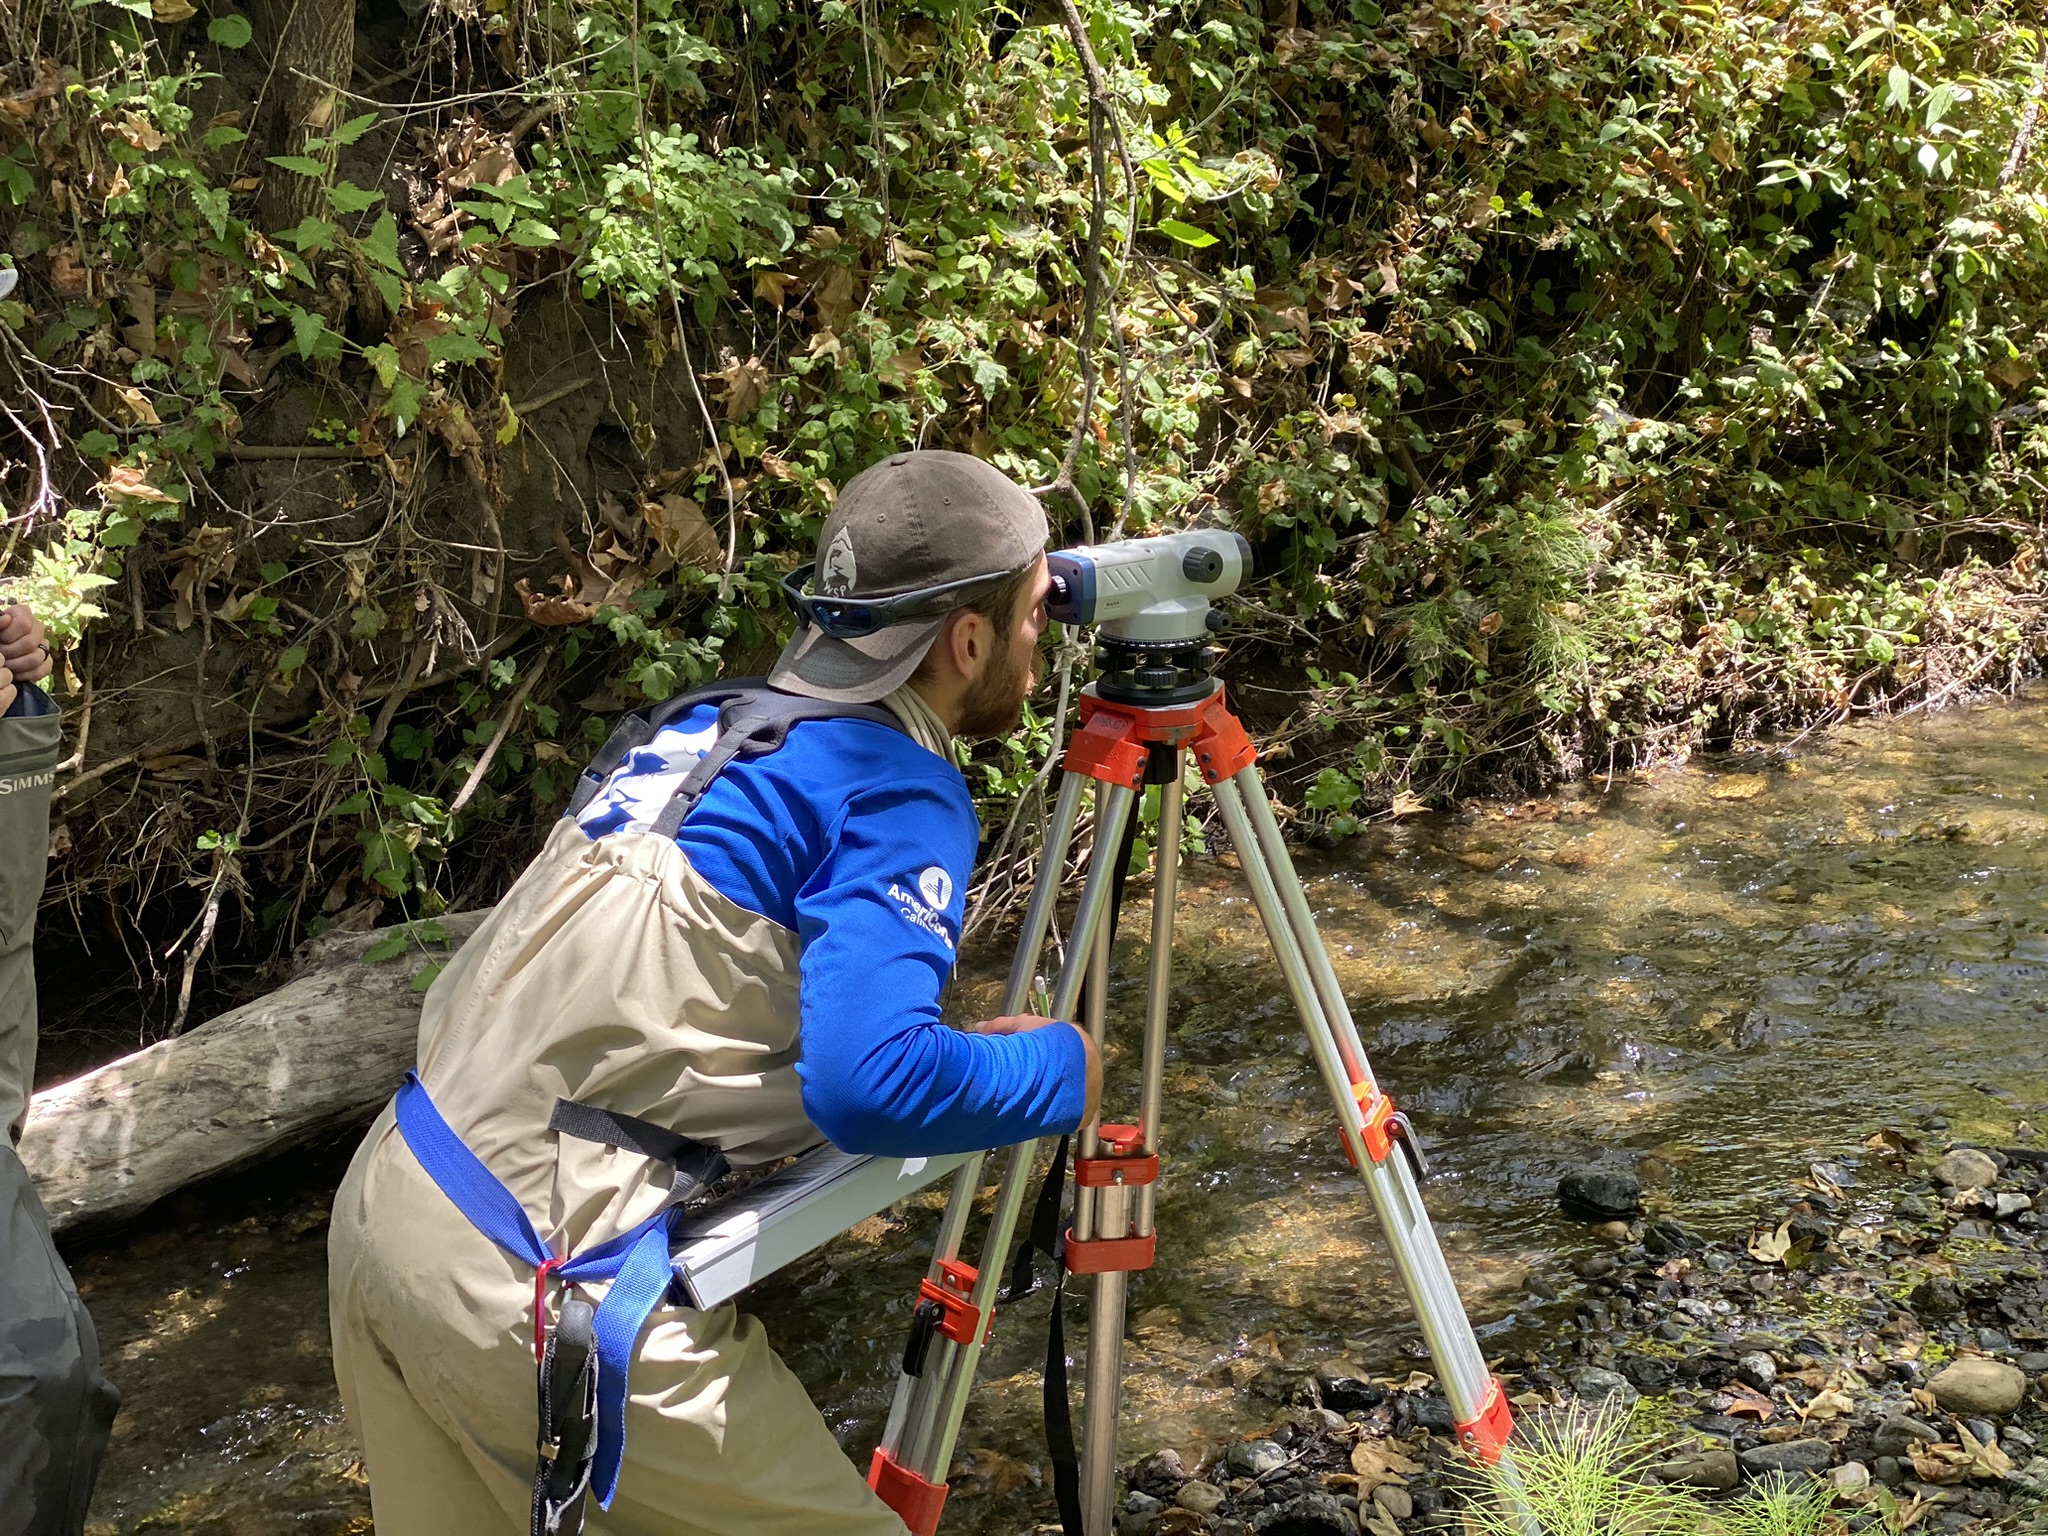
Bioassessment is a monitoring tool that we use to evaluate creek health. Staff and volunteers work as a team to collect measurements like creek width and depth, rock size, channel slope, tree cover, bank stability, and much more. The nearly 1,500 measurements collected at each site help us determine if our local creeks can support sensitive aquatic species like steelhead.
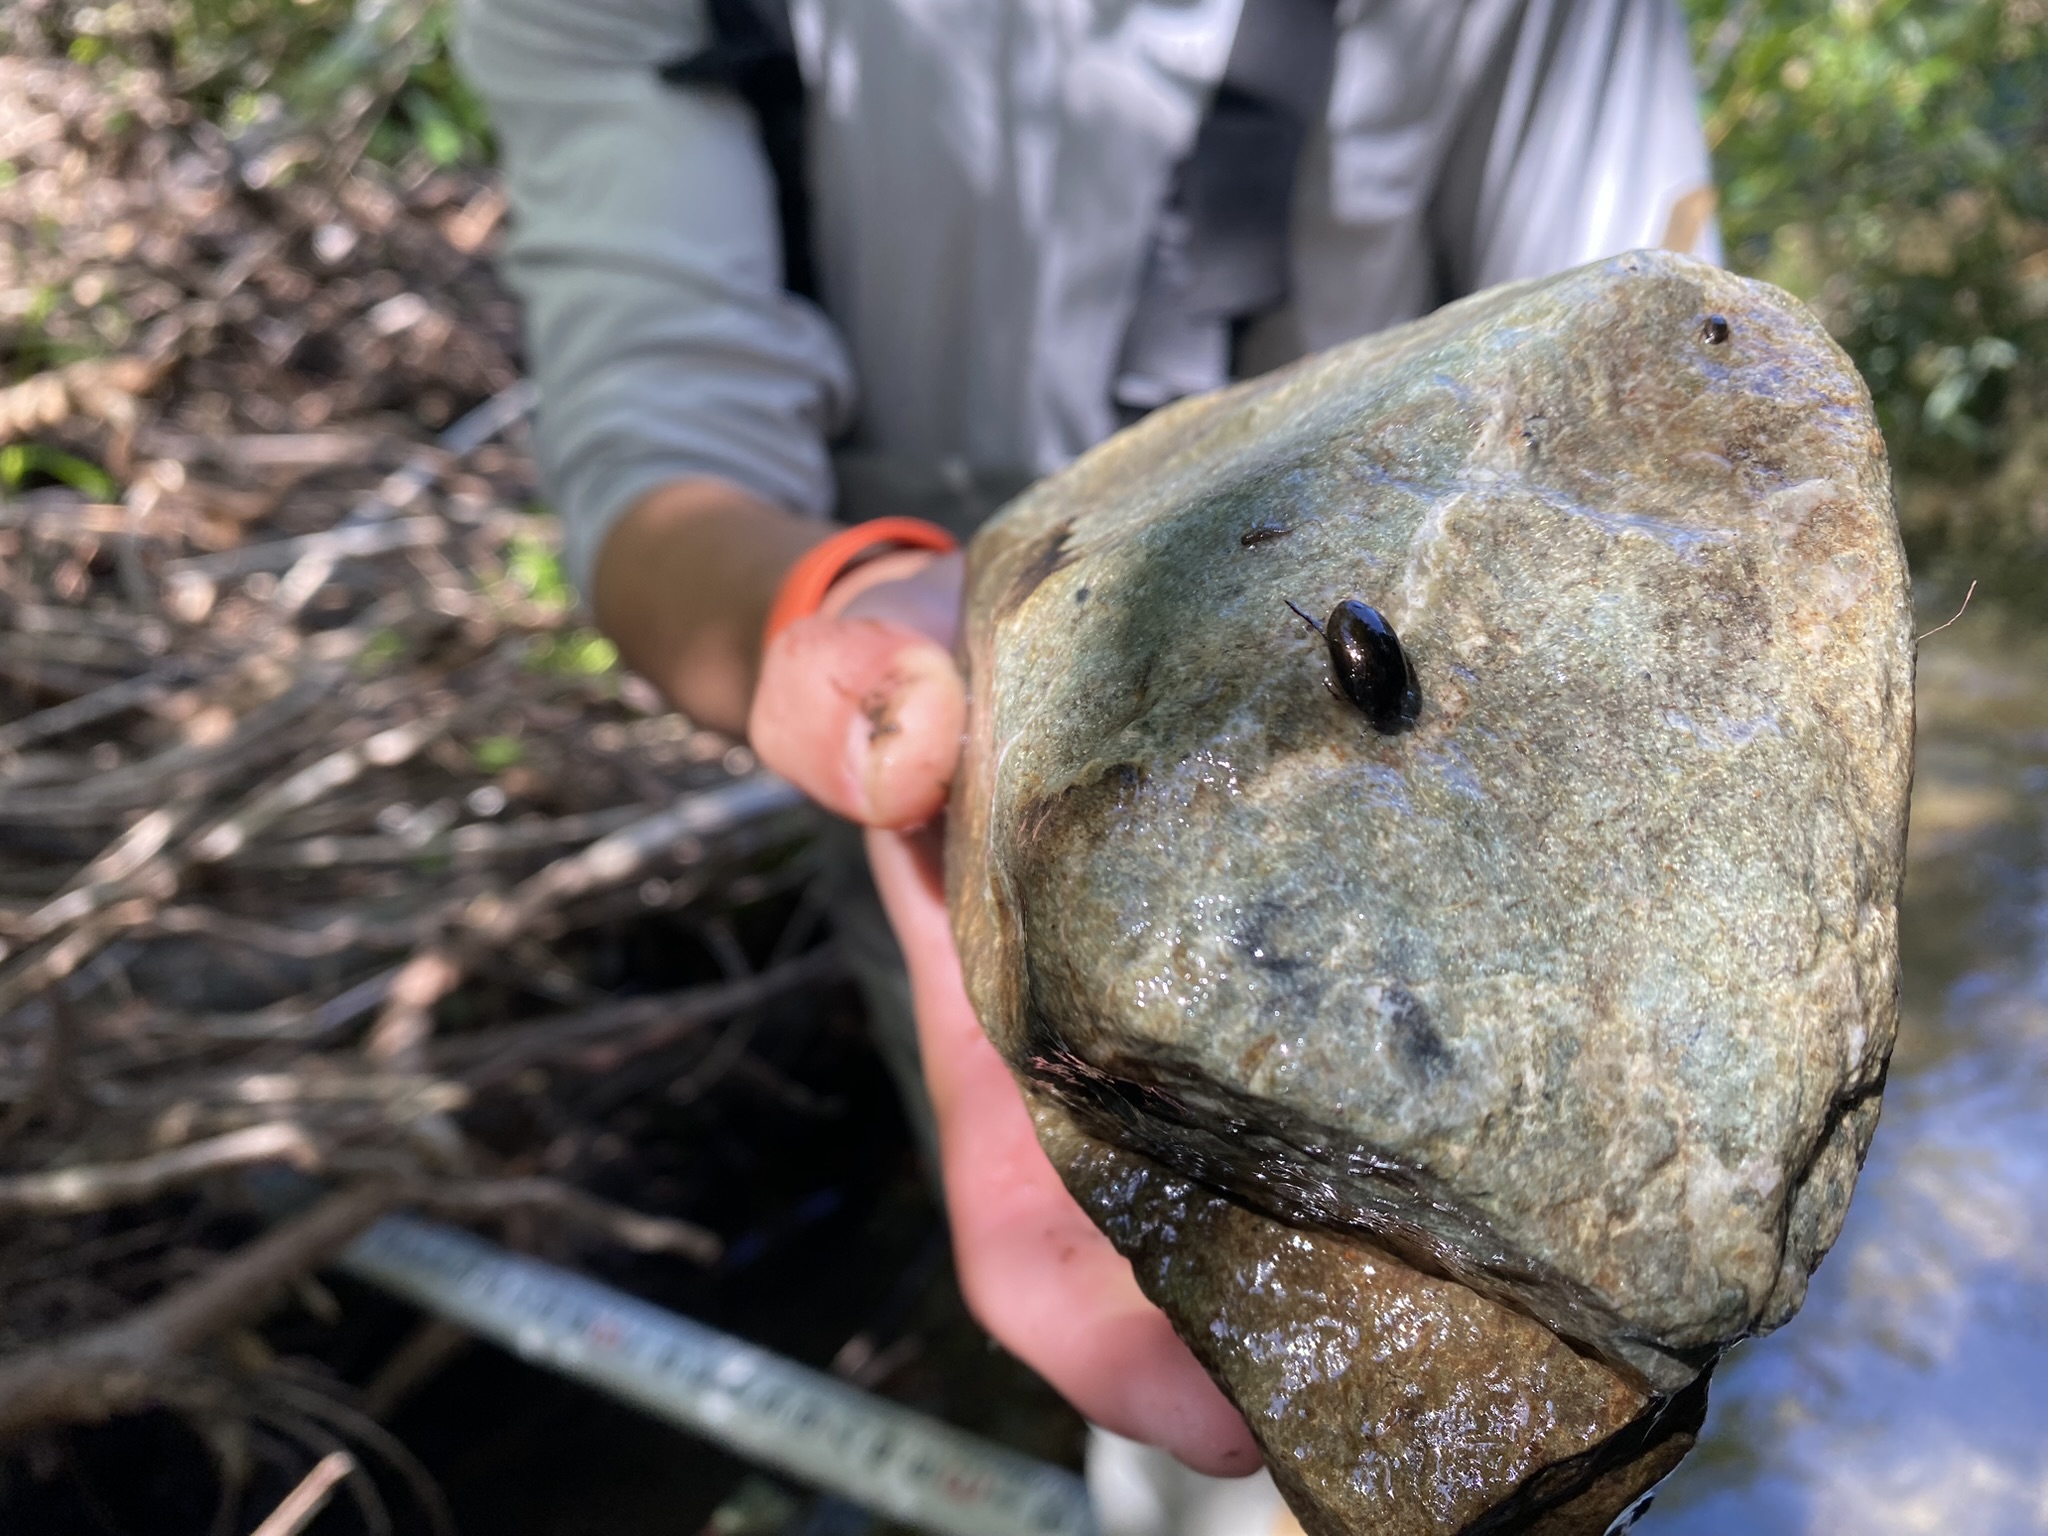
A key component of our monitoring is the collection of benthic macroinvertebrates (BMIs), which are the insects that dwell on the creek bottom. These creatures are great bioindicators, meaning that their presence or absence tells us something about creek health. While some species are very sensitive to pollution, others can tolerate or even thrive in polluted waters. The presence of sensitive species indicates that the water quality is likely good, whereas a large number of pollution-tolerant species may indicate poor conditions.
Our 2024 Field Effort
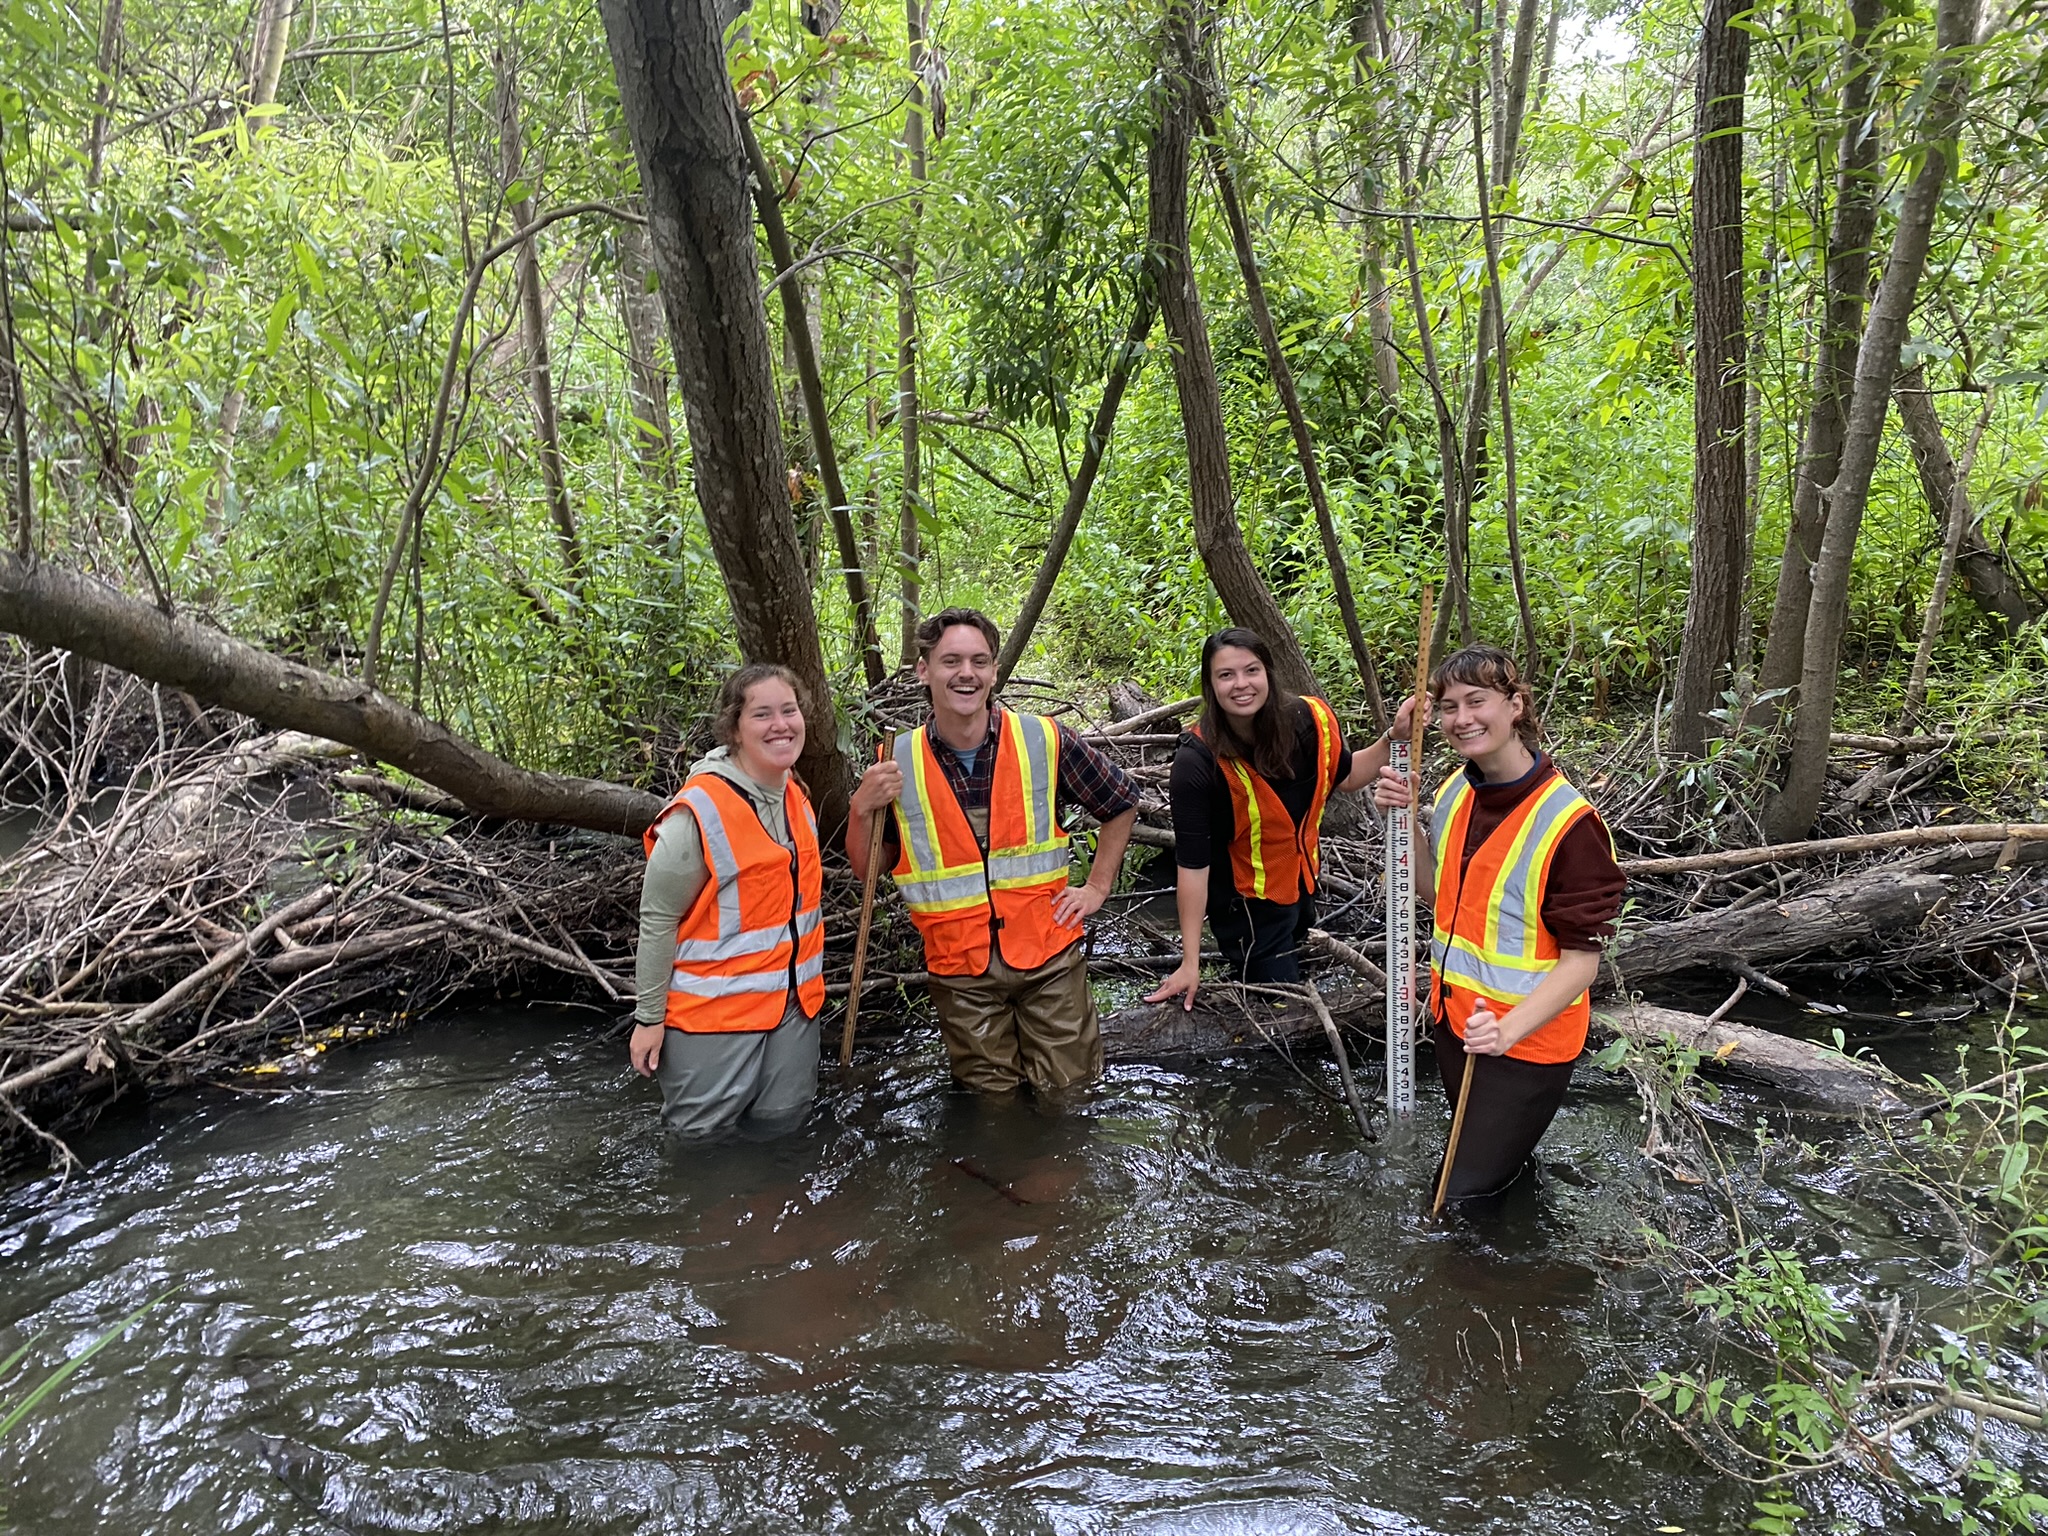
Last year’s field effort was supported by volunteers from Cal Poly’s Natural Resources Management & Environmental Sciences Department and Corpsmembers from the California Conservation Corps Watershed Stewards Program. Our collaborative team surveyed ten creek sites: three sites on Chorro Creek, two sites on San Luisito Creek, and one site each on Pennington, Dairy, San Bernardo, Walters, and Los Osos Creeks. The results from each of these monitoring sites provide insight into stream conditions throughout the watershed.
To read more about highlights from our 2024 field effort, check out this blog.
Our 2024 Results
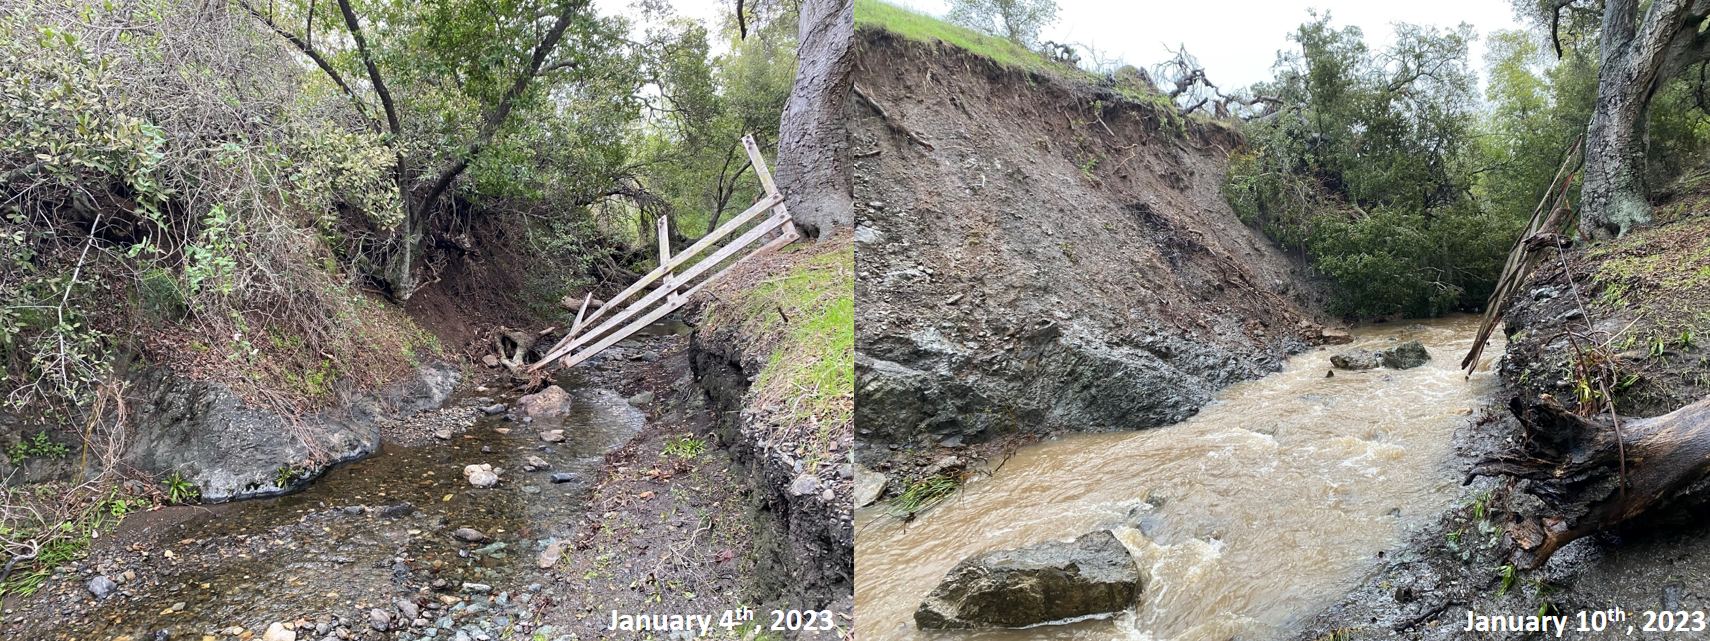
In 2023, the Morro Bay watershed experienced heavy rainfall that caused flooding, erosion, and large amounts of sediment flushed downstream. Because these conditions altered the streambed, they also displaced the BMI communities that live among the rocks and gravel at the creek bottom. The most severe impacts to BMIs were seen in the smaller tributary creeks. Creeks like Pennington and Dairy that usually have high quality habitat showed signs of alteration and disturbance in 2023.
The results from 2024, however, indicated widespread recovery from the damaging storms of 2023. We used a biological scoring tool called the California Stream Condition Index (CSCI) to compare results between years. All sites showed improvement from 2023 to 2024, with tributary sites showing the most improvement. Most notably, the Upper Dairy Creek score improved by 73%. Other tributaries like San Bernardo and Pennington Creeks also showed impressive increases of approximately 50%.
CSCI Comparison
The graph below compares CSCI scores from 2023 (in light blue) and 2024 (in dark blue) to the average of historic data from 1994 to 2024 (in grey). Sites without a light blue bar indicate that the site was not monitored in 2023. The multi-colored horizontal dotted lines delineate the five CSCI score categories, which range from “Very Good” to “Very Poor.” To learn more about this scoring system, you can visit the California Water Board’s CSCI Fact Sheet.
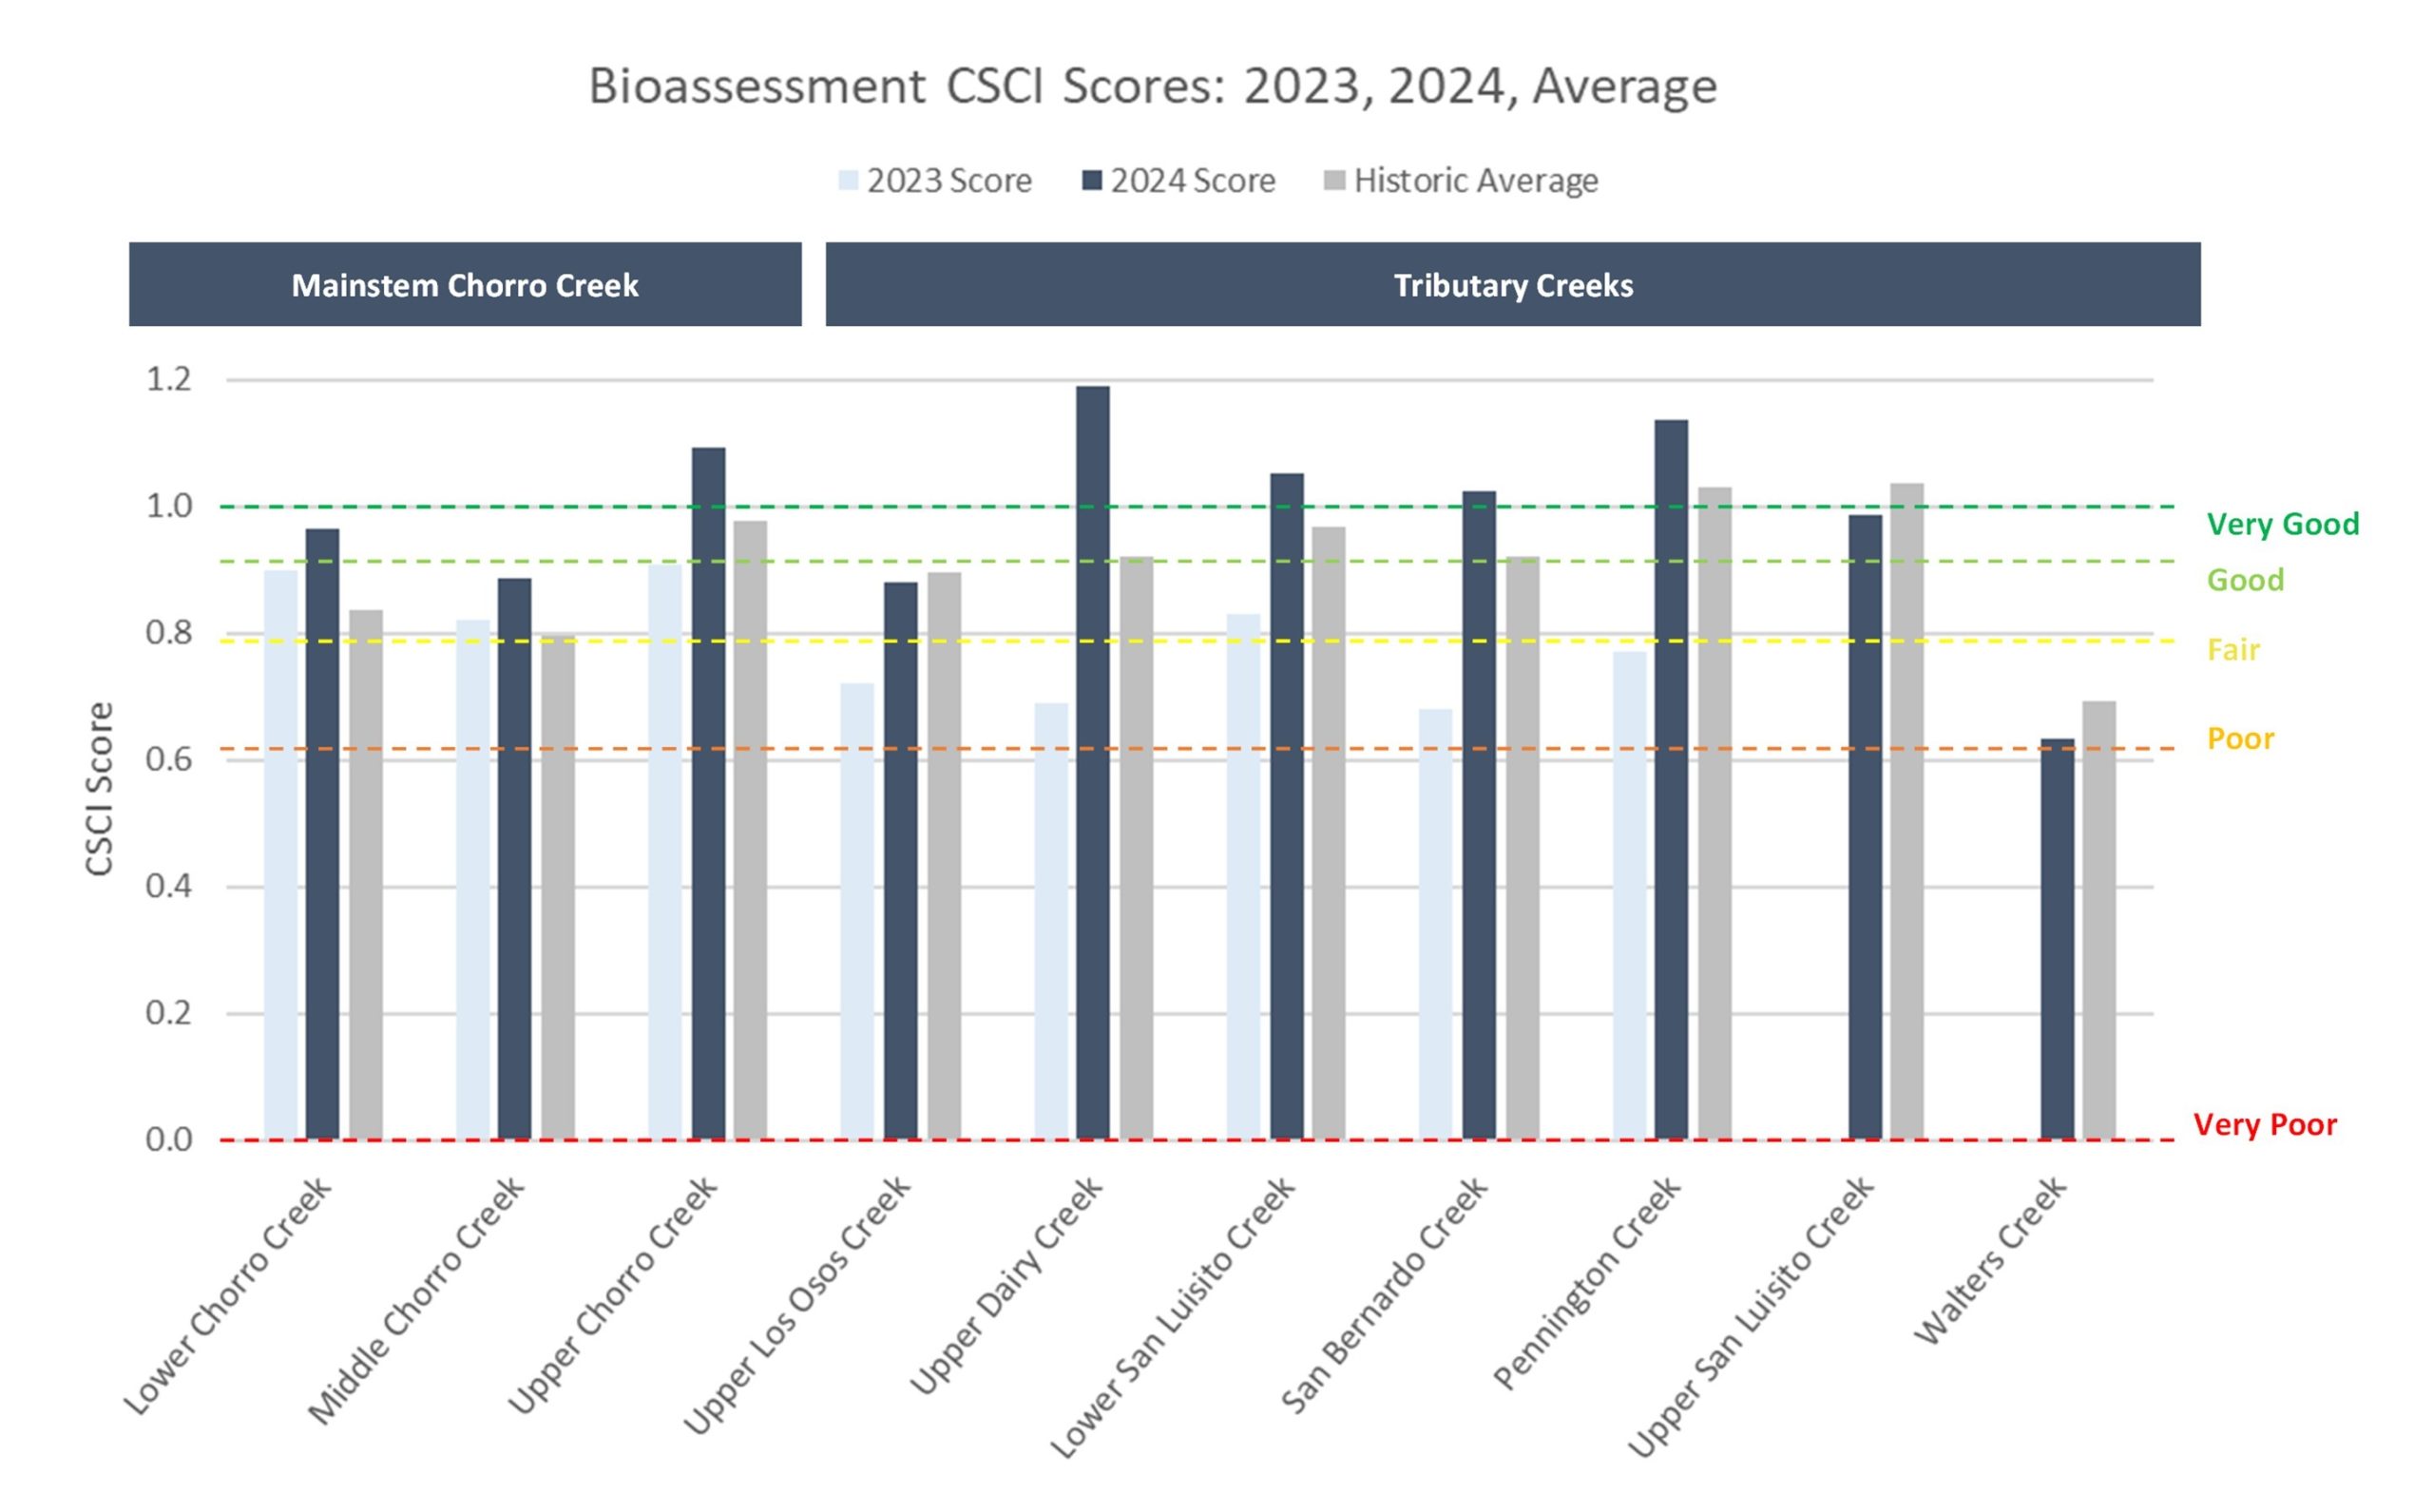
These results provide insight into the resilience and recovery time for each monitoring site. For example, sites on lower and middle Chorro Creek were less affected by the disturbances of 2023 than tributaries like San Bernardo, Dairy, and Pennington Creeks. But after just one year of recovery time, all three tributary sites scored higher than their historic average, while the middle and lower Chorro Creek sites saw only minor improvements. These findings are consistent with recent research which has found that BMI communities in smaller streams like Dairy, Pennington, and San Bernardo may be more vulnerable to flooding and disturbance in the short-term but can recover quickly due to their size (Stamp et al., 2020; Baumann et al., 2024).
Slower Recovery
Although all of the tributary scores increased between 2023 and 2024, two sites appear to be slower to recover. Upper Los Osos Creek, which has historically scored quite well, only improved by 22% in 2024. When this site has scored poorly in the past, it has typically taken two or three years for scores to improve. The exact reason for the slower recovery at this site is unknown, but it is likely due to site-specific characteristics that are not present in the other tributaries.
The only site that scored poorly during 2024 was Walters Creek located near the shooting ranges west of Dairy Creek Golf Course. We were interested in this data because it will serve as valuable baseline information for future restoration efforts on Walters Creek. When restoration work is complete, we will re-survey the site to get a better sense of the impact of the restoration project on BMI communities.
Recognition for the Miossi Trust
This valuable data is made possible through the continued support of the Harold J. Miossi Charitable Trust. Since 2013, the Trust has provided over $140,000 to this effort. This long-running dataset has benefitted our program by helping us track long-term changes over time, assess watershed health, and prioritize conservation and restoration efforts. To learn more about the Miossi Charitable Trust, please visit https://www.miossicharitabletrust.org/.
References
Stamp, J., Moore, A., Fiske, S., Gerritsen, J., Bierwagen, B., & Hamilton, A. (2020). Effects of extreme high-flow events on macroinvertebrate communities in Vermont streams. River Research and Applications, 36 (10), 1891–1902. https://doi.org/10.1002/rra.3713
Baumann, K. A., Scholl, E. A., Rantala, H. M., & Whiles, M. R. (2024). Macroinvertebrate community responses to disturbance in a fragmented river with contrasting legacies of alteration. River Research and Applications. U.S. Geological Survey. https://doi.org/10.1002/rra.4385
Help us protect and restore the Morro Bay estuary!
- Donate to the Estuary Program today and support our work in the field, the lab, and beyond.
The Estuary Program is a 501(c)3 nonprofit. We depend on funding from grants and generous donors to continue our work. - Support us by purchasing estuary-themed gear from ESTERO. This locally owned and operated company donates 20% of proceeds from its Estuary clothing line and 100% of Estuary decal proceeds to the Estuary Program. Thank you, ESTERO!
- Purchase items from the Estuary Program’s store on Zazzle. Zazzle prints and ships your items, and the Estuary Program receives 10% of the proceeds.
- Subscribe to our seasonal newsletter: Between the Tides!
- We want to hear from you! Please take a few minutes to fill out this short survey about what type of events you’d like to see from the Estuary Program. We appreciate your input!