The dramatic high and low tides of the fall offer a great opportunity to monitor Morro Bay’s intertidal habitat. Extreme low tides reveal areas of the bay that are usually fully or partially submerged in water. Each year, our staff take advantage of these tide windows to gather valuable data on eelgrass distribution and health. To learn more about eelgrass and our work in Morro Bay, please visit www.mbnep.org/eelgrass.
Eelgrass Mapping and Validation
Since the 1960s, there have been efforts to create baywide maps of Morro Bay’s eelgrass. While early methods were fairly low tech (think compass and hand drawn maps), more recent efforts have included multi-spectral imagery collected from a plane, sonar, and automated map creation conducted by software models. Since 2017, we have partnered with Cal Poly to conduct drone flights over Morro Bay during extreme low tides to capture high-resolution imagery of the exposed intertidal zone. These images are woven together to create a detailed baywide eelgrass map to help us understand changes in eelgrass extent from year to year.
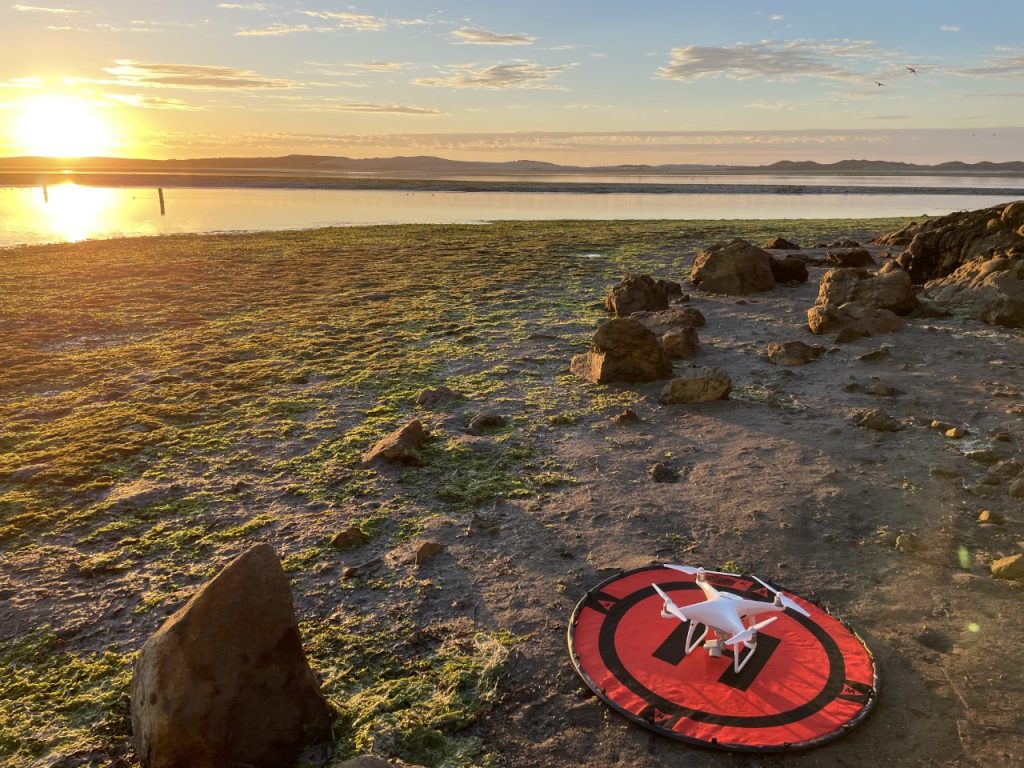
The drone captures images as it flies over the bay, which are then stitched together to create a single high-resolution image. Historically, Estuary Program and Cal Poly staff would manually create the map by tracing polygons around each eelgrass bed using mapping software. When eelgrass acreage in Morro Bay was at historic lows (like in 2017 when only 13 acres were mapped), this effort could be completed in a reasonable amount of time. As eelgrass expanded throughout the bay (reaching 750 acres in 2023), the manual mapping method became prohibitively time intensive. To streamline the process, Cal Poly is developing a computer model to automate map creation. Once completed, the program would save thousands of hours of manual digitizing and create more consistent results.
While the drone imagery is very high quality, it is sometimes challenging for the new model to distinguish whether the vegetation pictured is eelgrass, green algae, or a pile of dead eelgrass (known as “wrack”). To help verify the model results, the Estuary Program collects hundreds of on-the-ground data points using high accuracy GPS units. This approach, called “ground-truthing,” provides direct field observations to help the model accurately identify what is pictured in the image.
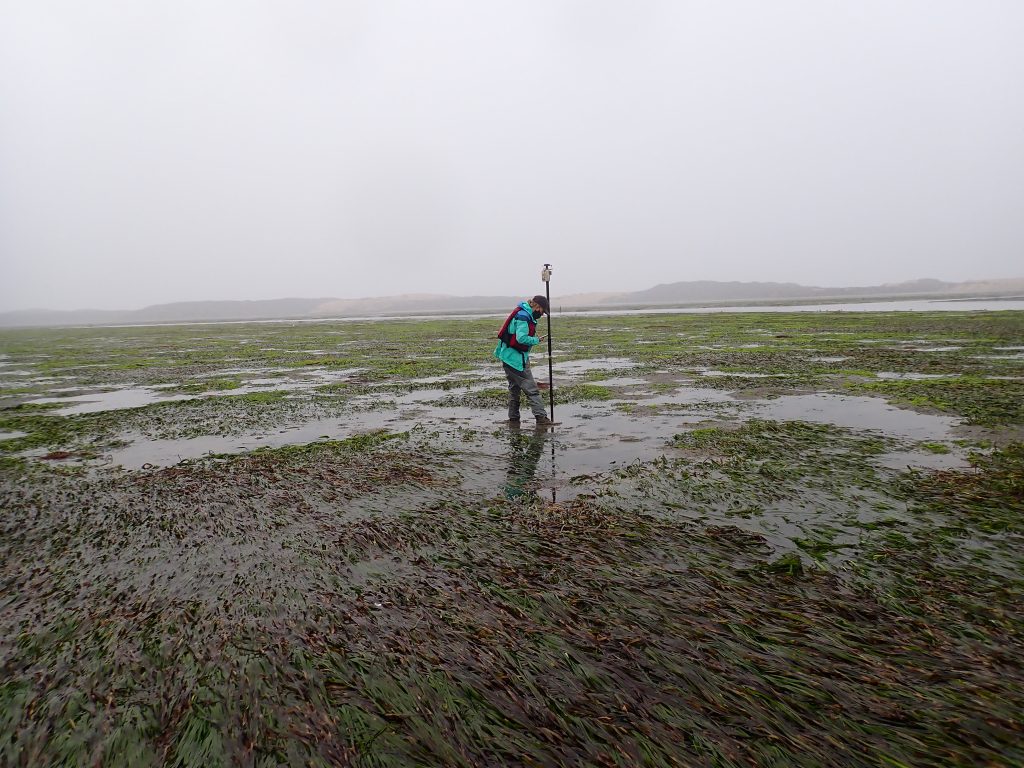
During the low tides of November and December, Estuary Program staff, Watershed Stewards Program Corpsmembers (a California Conservation Corps program in partnership with AmeriCorps), and students from Cal Poly collected 360 ground-truthing points in the bay between Morro Rock and Sweet Springs Nature Preserve in Los Osos. The ground-truthing effort will continue into late January with the goal of collecting 500 data points distributed throughout the bay.
Fall Eelgrass Monitoring
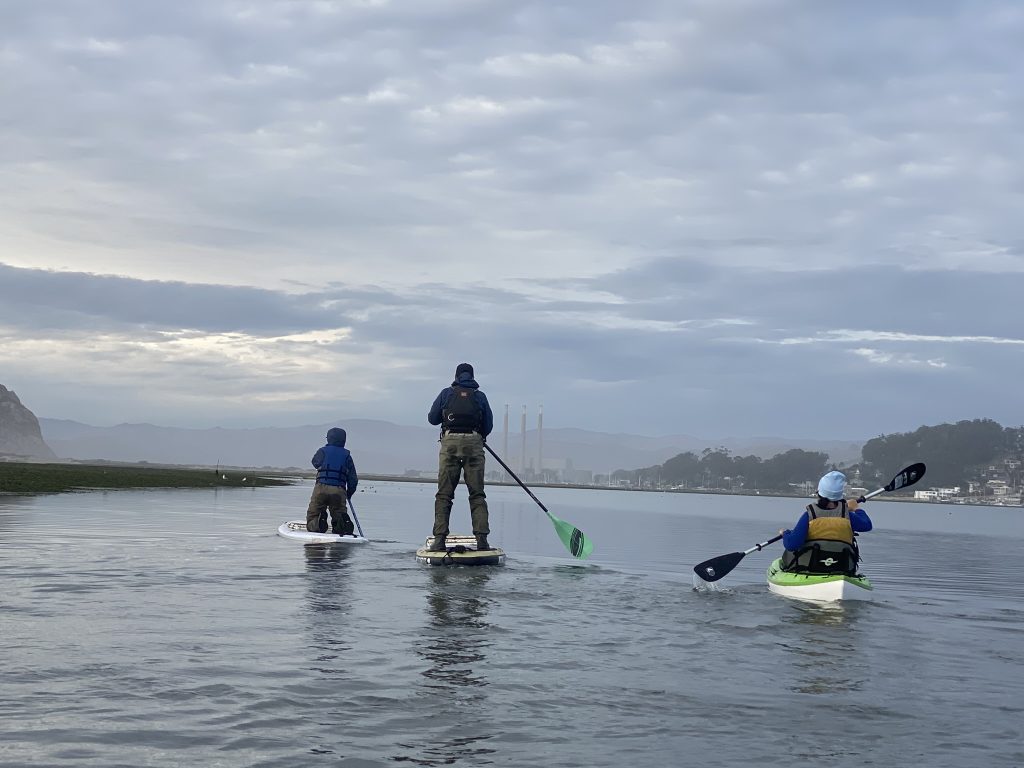
Each year during the extreme low tides of the fall, Estuary Program staff paddle out to six intertidal eelgrass monitoring locations in Morro Bay. Many of these sites were established over twenty years ago. The data and photos we collect help us track changes in eelgrass density at specific locations. In general, denser eelgrass beds indicate healthier ecosystems than those with sparse or patchy cover.
One of the six monitoring sites is located in the mid-bay, about half a mile north of Pasadena Point. We’ve monitored this site nearly every year since 2005, and it has experienced dramatic changes in eelgrass extent over the past two decades. In 2008, it had one of the highest average densities among the sites monitored. But by 2010, the average shoot density had declined by 95%, and by 2013, the site had no eelgrass at all. For nearly five years, the site remained a bare mudflat until encouraging signs of recovery were seen in 2019. By 2021, eelgrass had rebounded to pre-decline levels which have remained stable.
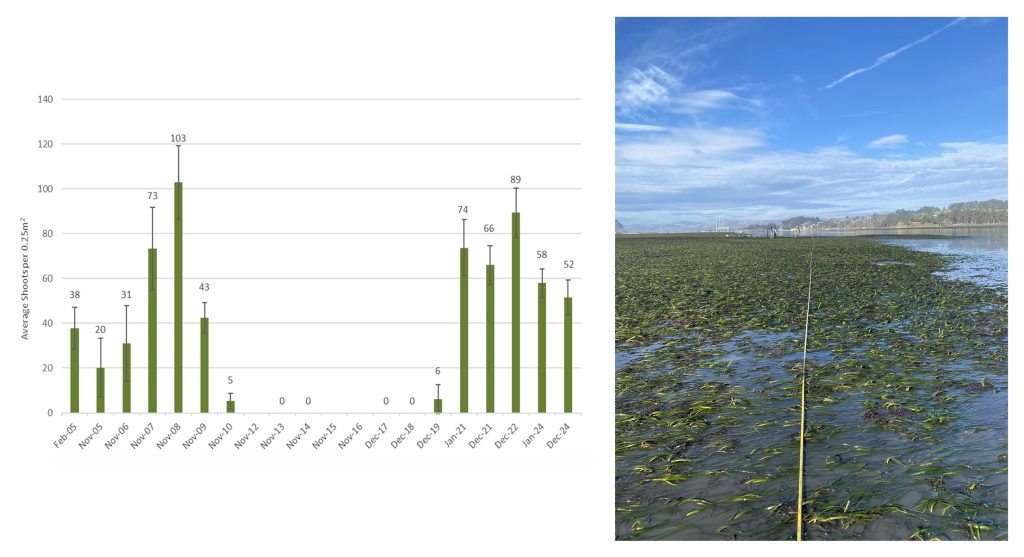
While this monitoring approach provides valuable insights into eelgrass density at specific locations, the survey is limited to what we find along a 50-meter-long transect and doesn’t account for what is happening nearby. During our most recent survey, our staff observed dense algae about 25 meters west of our monitoring site, which appeared to be encroaching on the eelgrass bed. Although eelgrass and algae often coexist, under certain conditions algae can crowd out eelgrass and impact the health of the bed. Observations like these highlight the importance of combining traditional surveys with tools like aerial imagery and mapping to better understand the broader changes in Morro Bay’s eelgrass beds.
Next Steps
Drone flights, groundtruthing, and on-the-ground surveys will continue throughout January 2025. These combined efforts will give us a clearer picture of the current health and extent of eelgrass in Morro Bay to help us assess change over time and prioritize our conservation and restoration efforts.
Help us protect and restore the Morro Bay estuary!
- Donate to the Estuary Program today and support our work in the field, the lab, and beyond.
The Estuary Program is a 501(c)3 nonprofit. We depend on funding from grants and generous donors to continue our work. - Support us by purchasing estuary-themed gear from ESTERO. This locally owned and operated company donates 20% of proceeds from its Estuary clothing line and 100% of Estuary decal proceeds to the Estuary Program. Thank you, ESTERO!
- Purchase items from the Estuary Program’s store on Zazzle. Zazzle prints and ships your items, and the Estuary Program receives 10% of the proceeds.
- Subscribe to our seasonal newsletter: Between the Tides!
- We want to hear from you! Please take a few minutes to fill out this short survey about what type of events you’d like to see from the Estuary Program. We appreciate your input!