As the title suggests, Morro Bay’s eelgrass beds have flourished across the estuary in recent years, surpassing both restoration targets and our expectations. Based on a map created from imagery collected in spring 2023, eelgrass extent in Morro Bay reached 750 acres. While this acreage is impressive, more context is needed to fully appreciate this period of eelgrass recovery. Over the past twenty years, eelgrass acreage in Morro Bay has experienced massive fluctuations. In the early 2000s, eelgrass was steadily recovering from a decline caused by wildfire and large El Niño storms. After reaching a peak of 344 acres in 2007, the bay faced an acreage loss of over 90% by 2017.
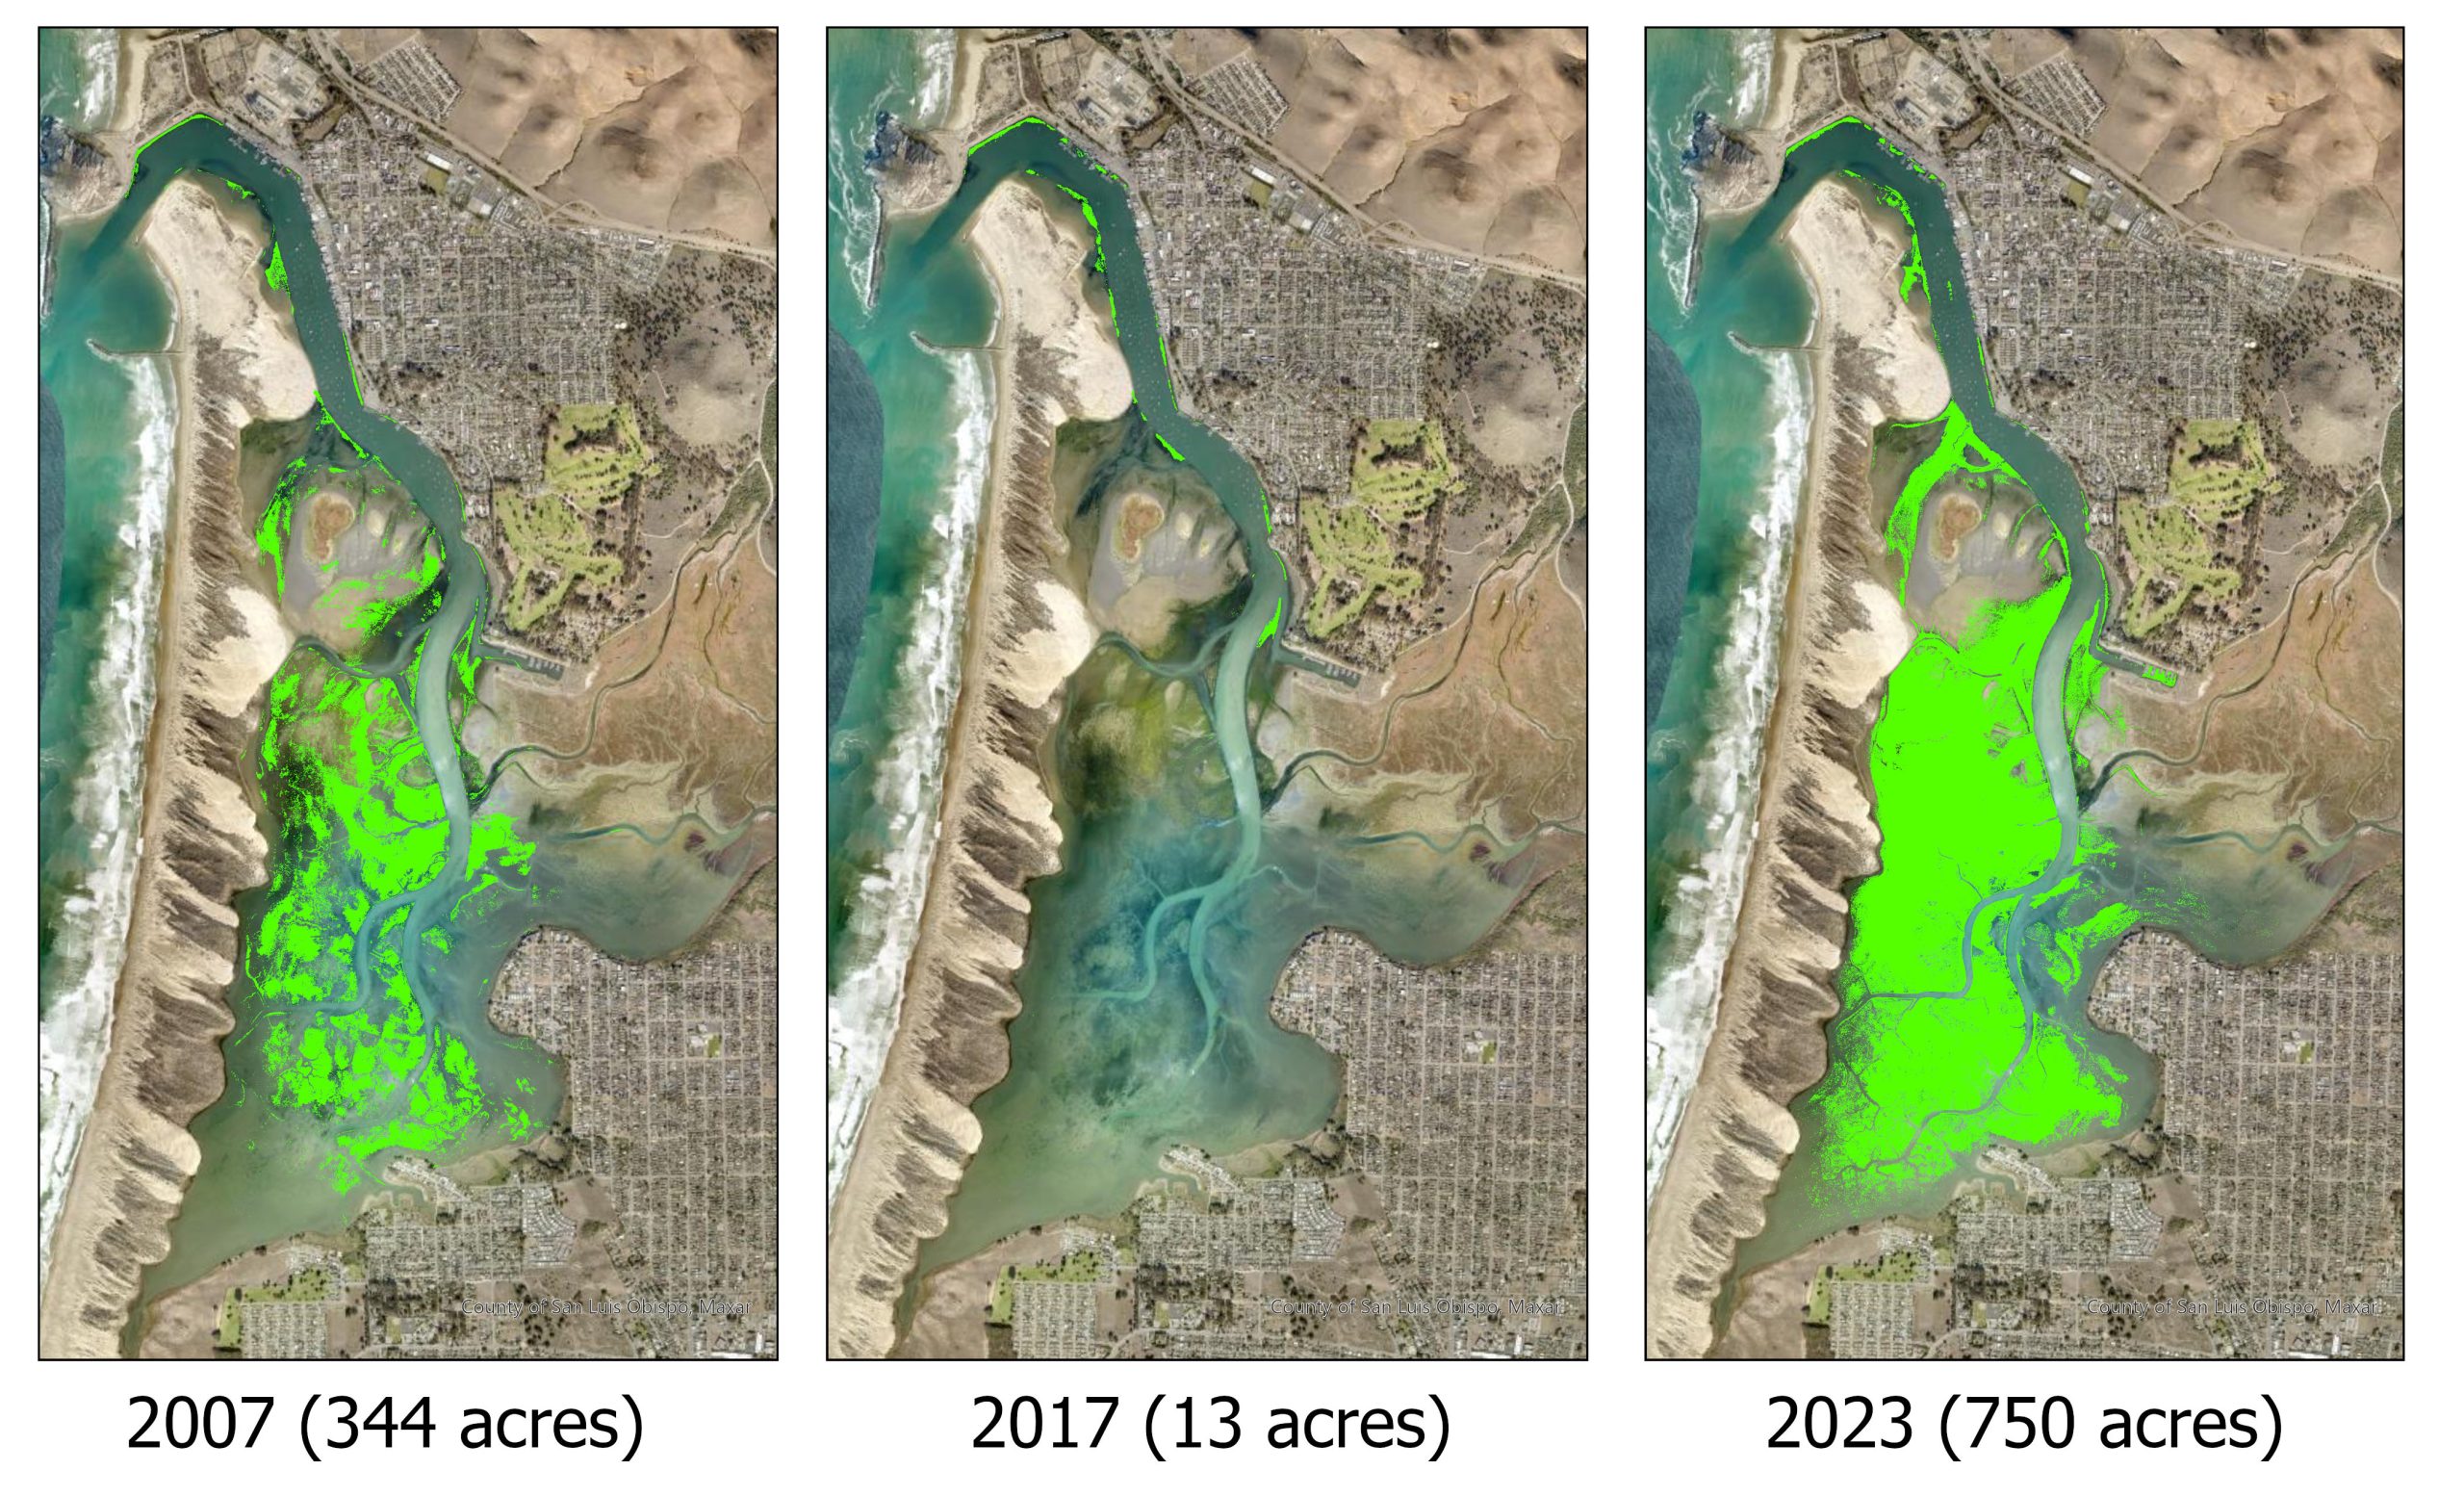
Since the lowest acreage recorded in 2017, eelgrass made an unprecedented comeback to 100 acres in 2020. Then, 500 acres the very next year, which was the highest acreage recorded since mapping began in the 1960s. And now our map from spring 2023 shows a new high of 750 acres. While this extraordinary recovery is great news for the estuary, it also brings up a lot of questions. We hope to address many here and in another upcoming blog post.
How It’s Made: Acreage Maps
Methods for mapping eelgrass have changed over time as technology has progressed. Some of the earliest estimates from the late 20th century relied on hand-drawn maps from field surveys. This progressed to aerial photography, then to multispectral imagery, and finally to high-resolution imagery captured by drone. The 2023 acreage map is unique in that it combines drone imagery with sonar surveys.
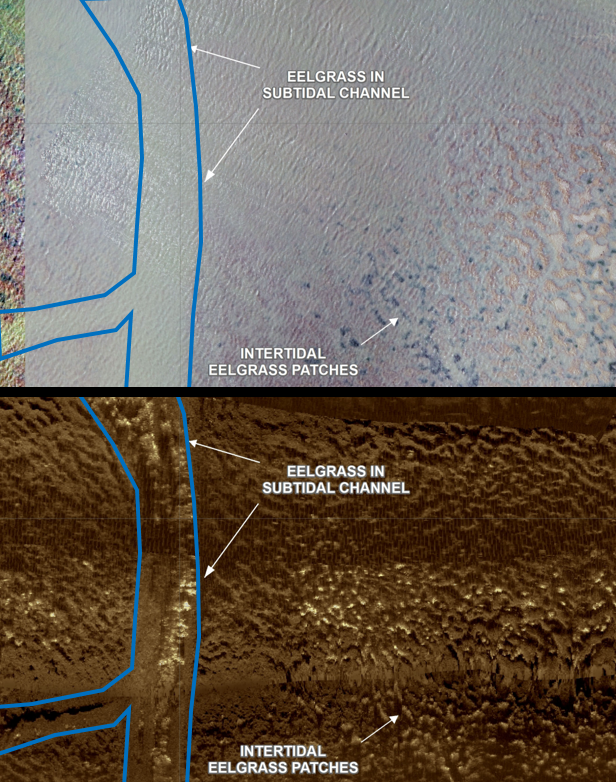
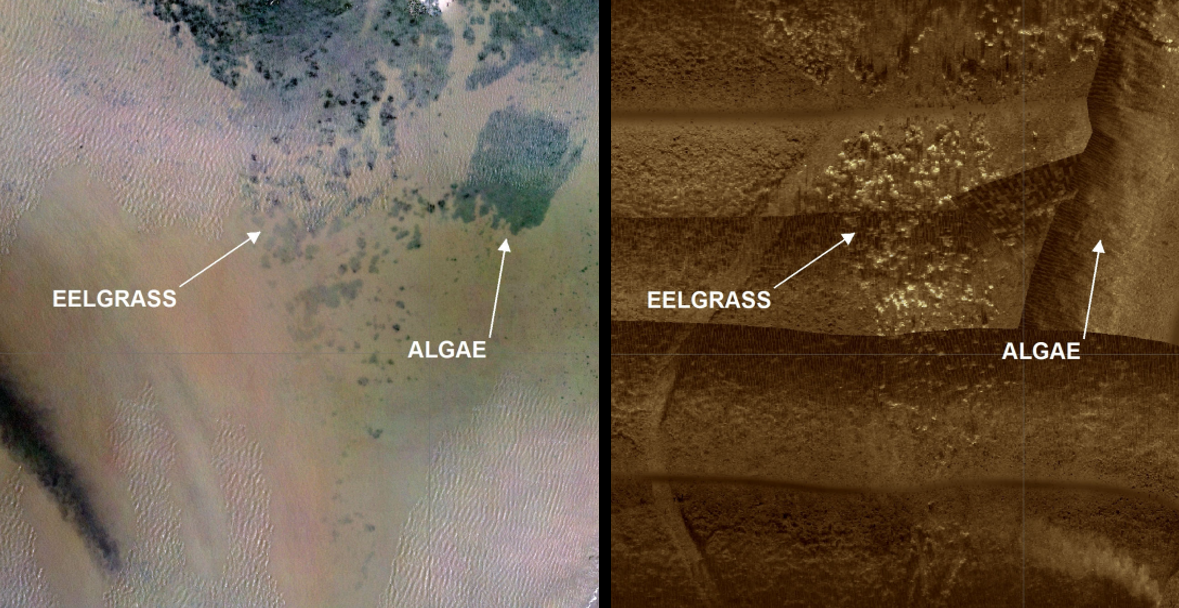
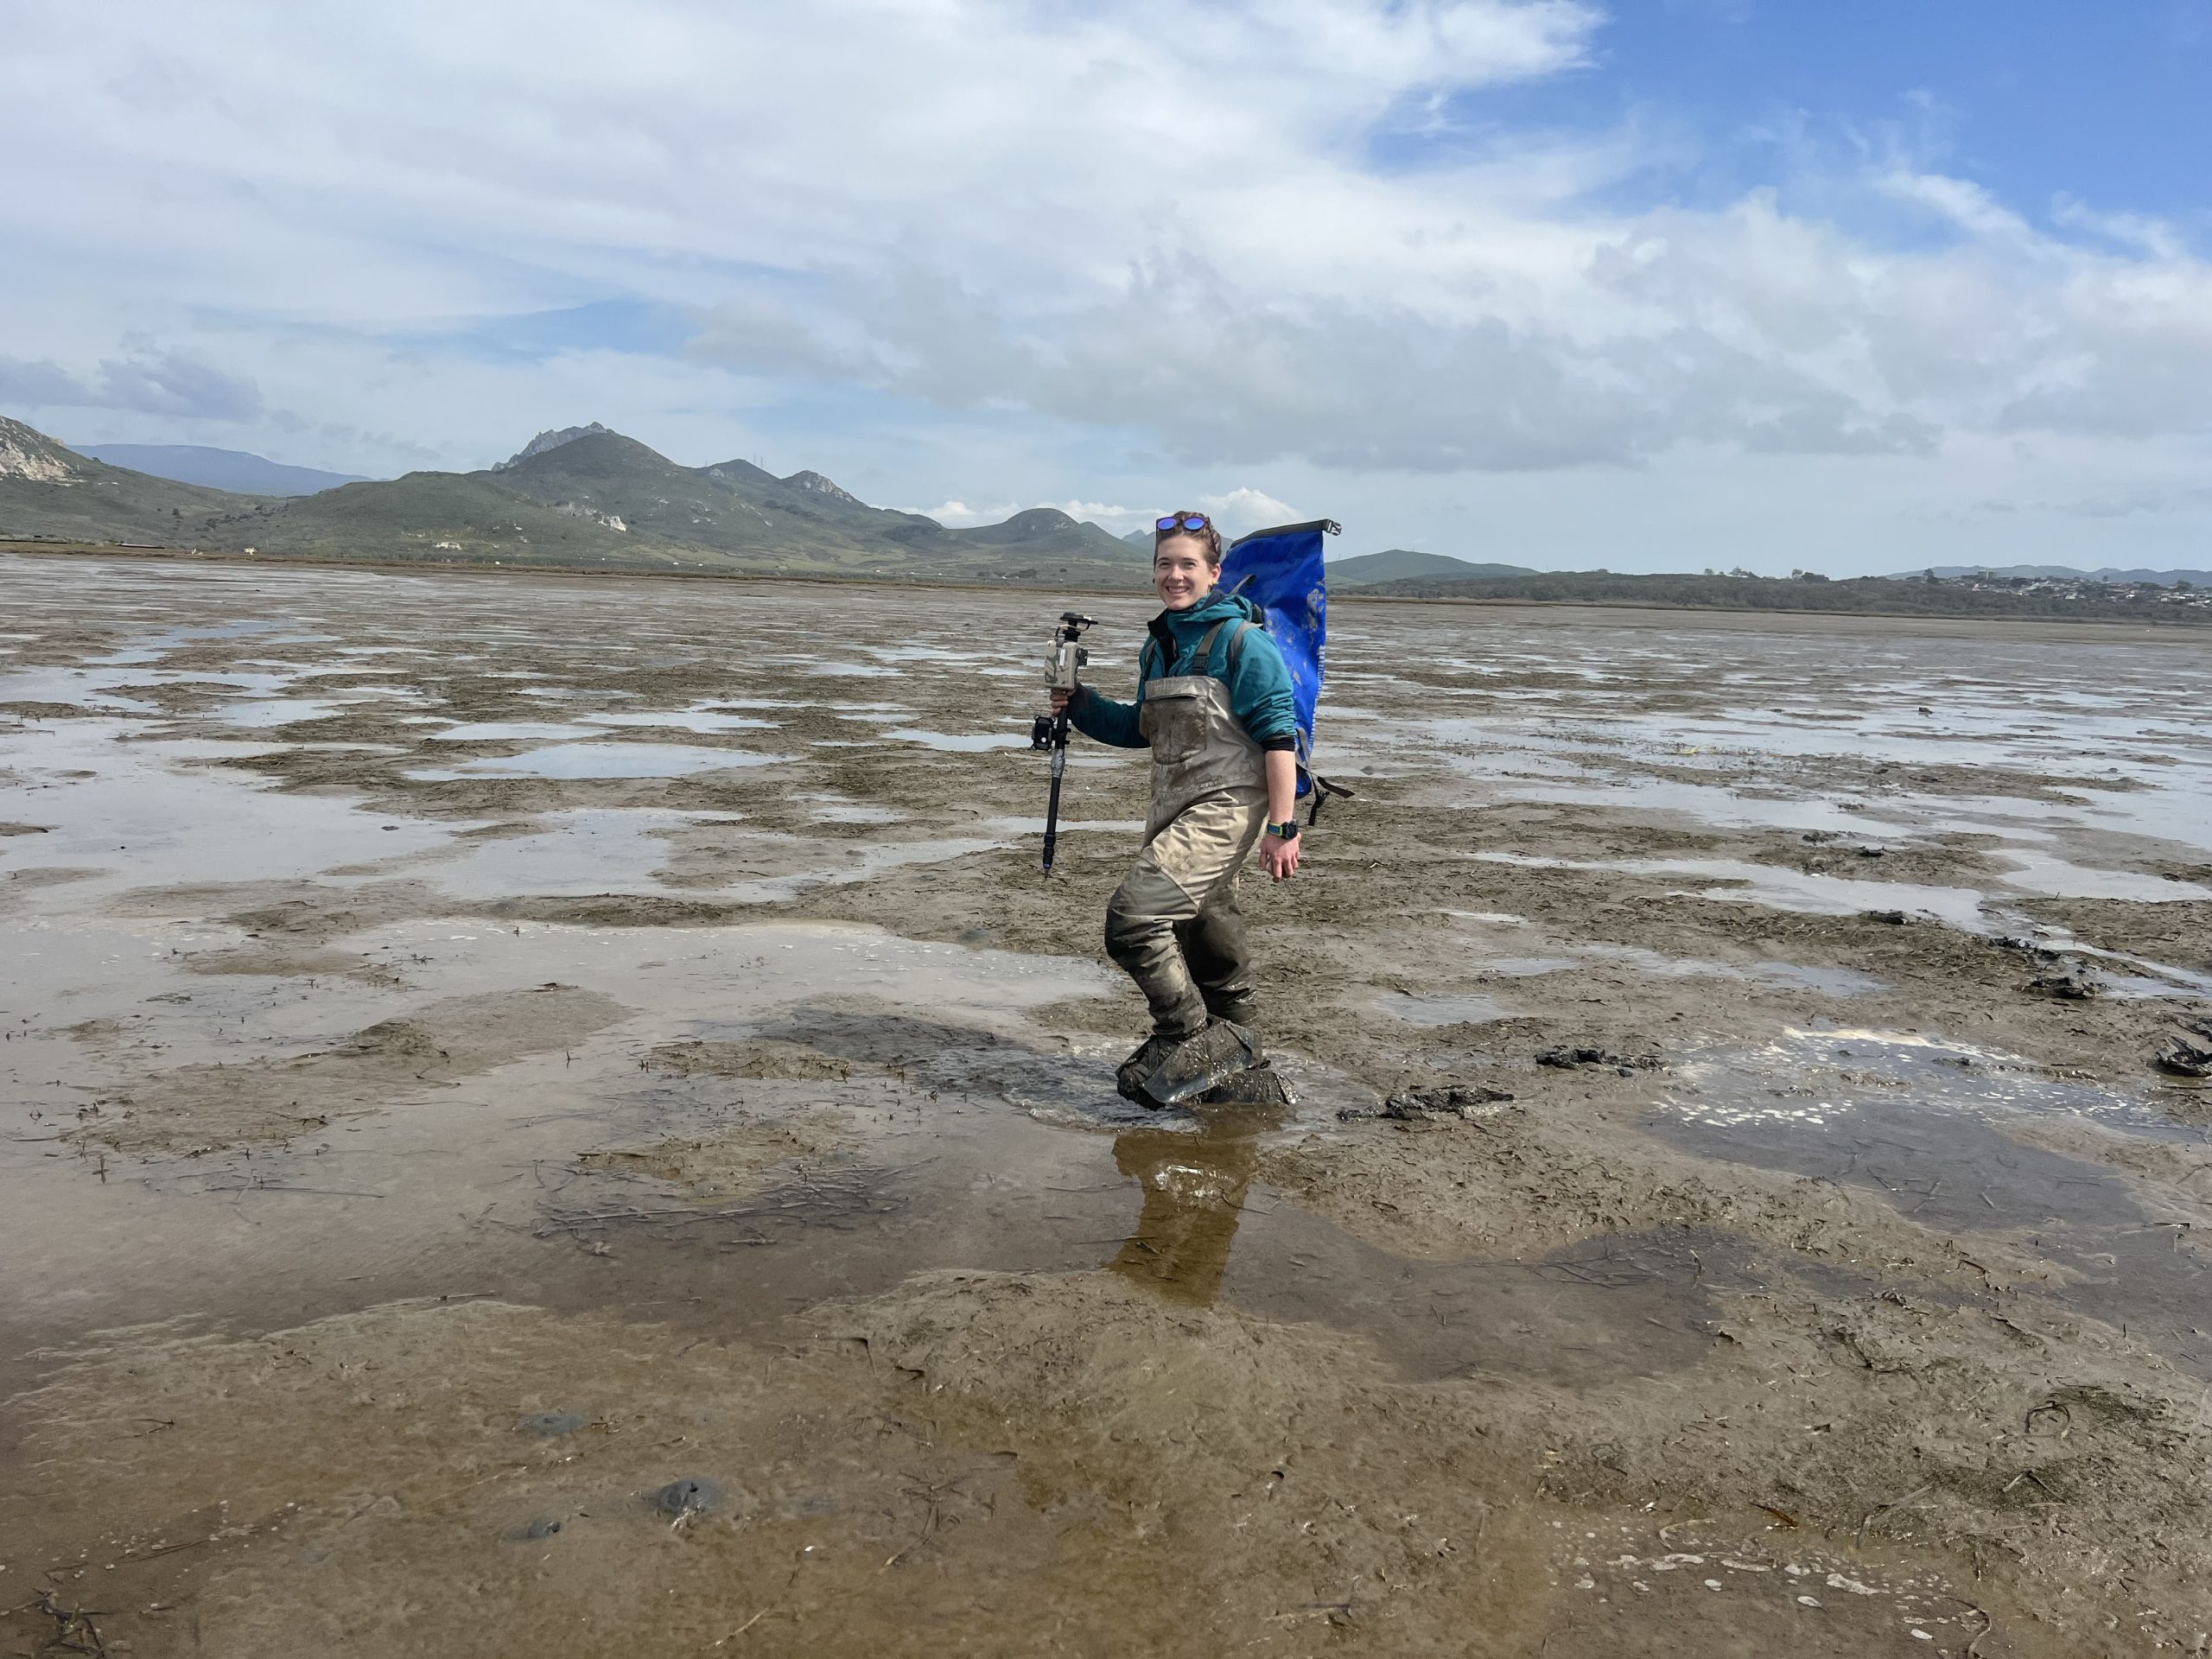
Drone surveys are conducted during some of the lowest tides of the year to capture the exposed eelgrass on the mudflats. This method misses out on submerged eelgrass in the deeper channels. Sonar is a helpful eelgrass mapping tool because it is not limited by water depth and clarity. Sonar surveys are conducted from a boat during high tide. There, a transmitter sends pulses of sound through the water that bounce off the bottom of the estuary and are recorded by a receiver. The high density of air in eelgrass tissue makes it stand out amidst submerged algae. Sonar not only fills in eelgrass acreage missed by drones but also helps verify the type of vegetation present when they’re difficult to tell apart.
It is important to note the changes in mapping methods when comparing acreage numbers from year to year. However, the large scale recovery we’ve seen over the past several years is so extensive that it cannot be attributed to methodology changes alone. Even though subtidal acreage was included for 2023, this represented only 6% of the total acreage. If we exclude subtidal acreage, we’ve still surpassed all previous acreage numbers by more than 200 acres.
Considerations for Interpreting Acreage Results
Along with changing mapping methods, there are additional factors worth mentioning for our 2023 acreage results. One of the primary differences between the 2023 map and previous years is the use of spatial buffering. All eelgrass in the 2023 map was buffered by half a meter as defined by the California Eelgrass Mitigation Policy. This means that for each eelgrass shoot present, a square meter buffer was drawn around it and that entire area was counted as eelgrass. While this method takes into account the potential growth possible in eelgrass beds that are patchy, it likely contributes to higher acreage estimates than maps created without this buffer.
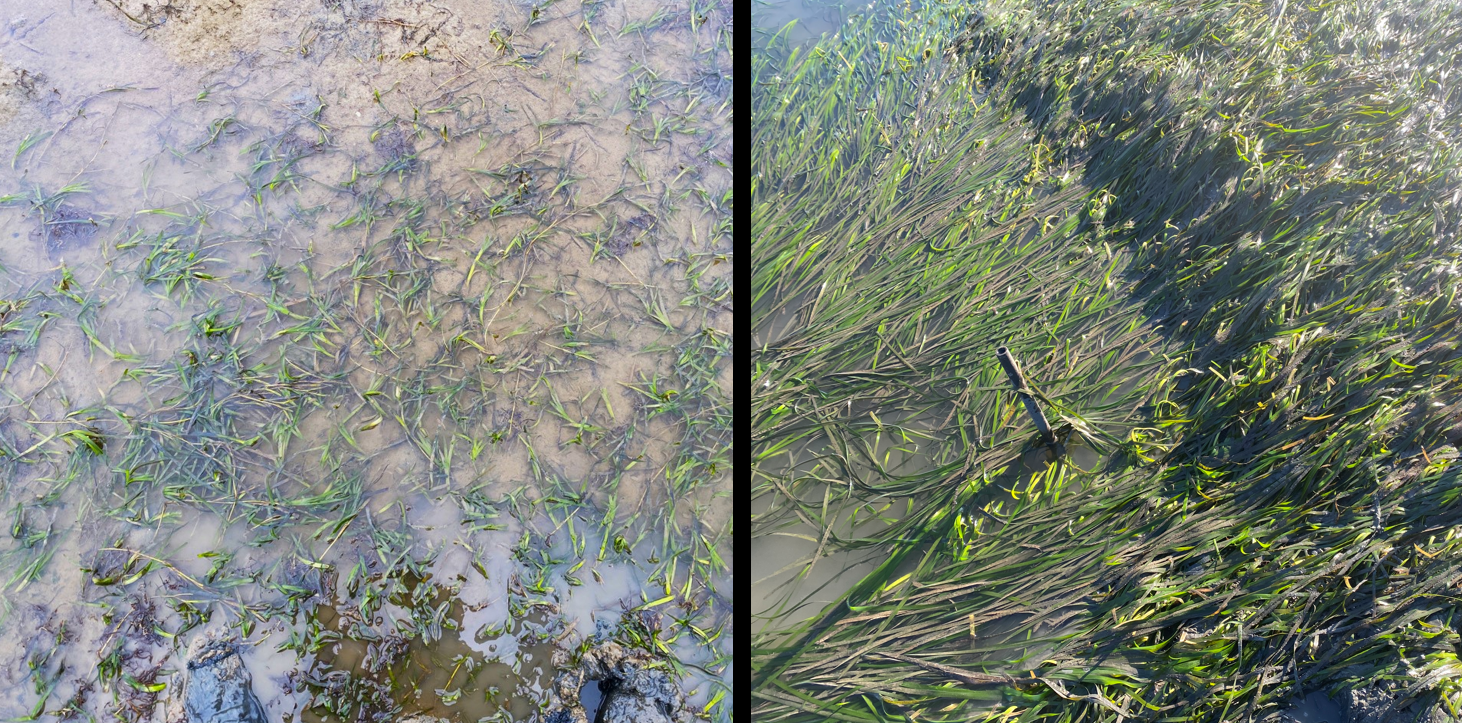
During the sonar and drone data collection in spring 2023, unusually cold temperatures delayed spring eelgrass growth and many of the beds had extremely short shoots and root systems with no shoots present, making it harder to identify eelgrass. It is likely that some eelgrass acreage was missed due to detection challenges while at the same time, overall acreage may have been inflated by the use of buffering.
Confirming the Numbers
To help ensure the accuracy of the 2023 map, the process included extensive ground-truthing using an underwater video camera during sonar surveys, lower altitude drone flights in smaller sections of the estuary, and low tide surveys to capture the vegetation types at specific GPS points. These efforts resulted in a final accuracy assessment of 95% for 2023. This number means that across the 2,000+ acres of estuary surveyed, only 5% of that area may have been misclassified.
Overall, interpreting eelgrass maps can be challenging, but the data has been thoroughly vetted to ensure the highest degree of accuracy and we can trust the broad trends in acreage we’ve seen over the past two decades. Keep an eye out for an upcoming blog post to learn more about potential driving factors and implications of this unprecedented expansion.
References
NOAA Fisheries, West Coast Region. 2014. California Eelgrass Mitigation Policy and Implementing Guidelines. October 2014. https://media.fisheries.noaa.gov/dam-migration/cemp_oct_2014_final.pdf
NOAA National Ocean Service. “What is sonar?”. Oceanservice.noaa.gov. Accessed August 12, 2024. https://oceanservice.noaa.gov/facts/sonar.html
Help us protect and restore the Morro Bay estuary!
- Donate to the Estuary Program today and support our work in the field, the lab, and beyond.
The Estuary Program is a 501(c)3 nonprofit. We depend on funding from grants and generous donors to continue our work. - Support us by purchasing estuary-themed gear from ESTERO. This locally owned and operated company donates 20% of proceeds from its Estuary clothing line and 100% of Estuary decal proceeds to the Estuary Program. Thank you, ESTERO!
- Purchase items from the Estuary Program’s store on Zazzle. Zazzle prints and ships your items, and the Estuary Program receives 10% of the proceeds.
- Subscribe to our seasonal newsletter: Between the Tides!
- We want to hear from you! Please take a few minutes to fill out this short survey about what type of events you’d like to see from the Estuary Program. We appreciate your input!